

Avoid Sideways, Save on Costs, Trade with Clarity
Overtrading in sideways markets eats into profits due to high costs and false signals. Use smart dashboards to identify clear market trends and avoid poor setups. Click on the image to gain deeper insights into the article.
General Trading Guidelines
Start small with 1 lot and always use stop-loss to manage risk. Focus on 5-minute charts, prefer ATM options, use VWAP for entry zones, and avoid choppy market sessions. Click on the image to gain deeper insights into the article.
Pre-Trade Checklist for Option Traders
Stay disciplined by analyzing technical trends, option chain, market breadth, FII data, global indicators, and news. This helps avoid impulsive decisions and improves consistency. Click on the image to gain deeper insights into the article.
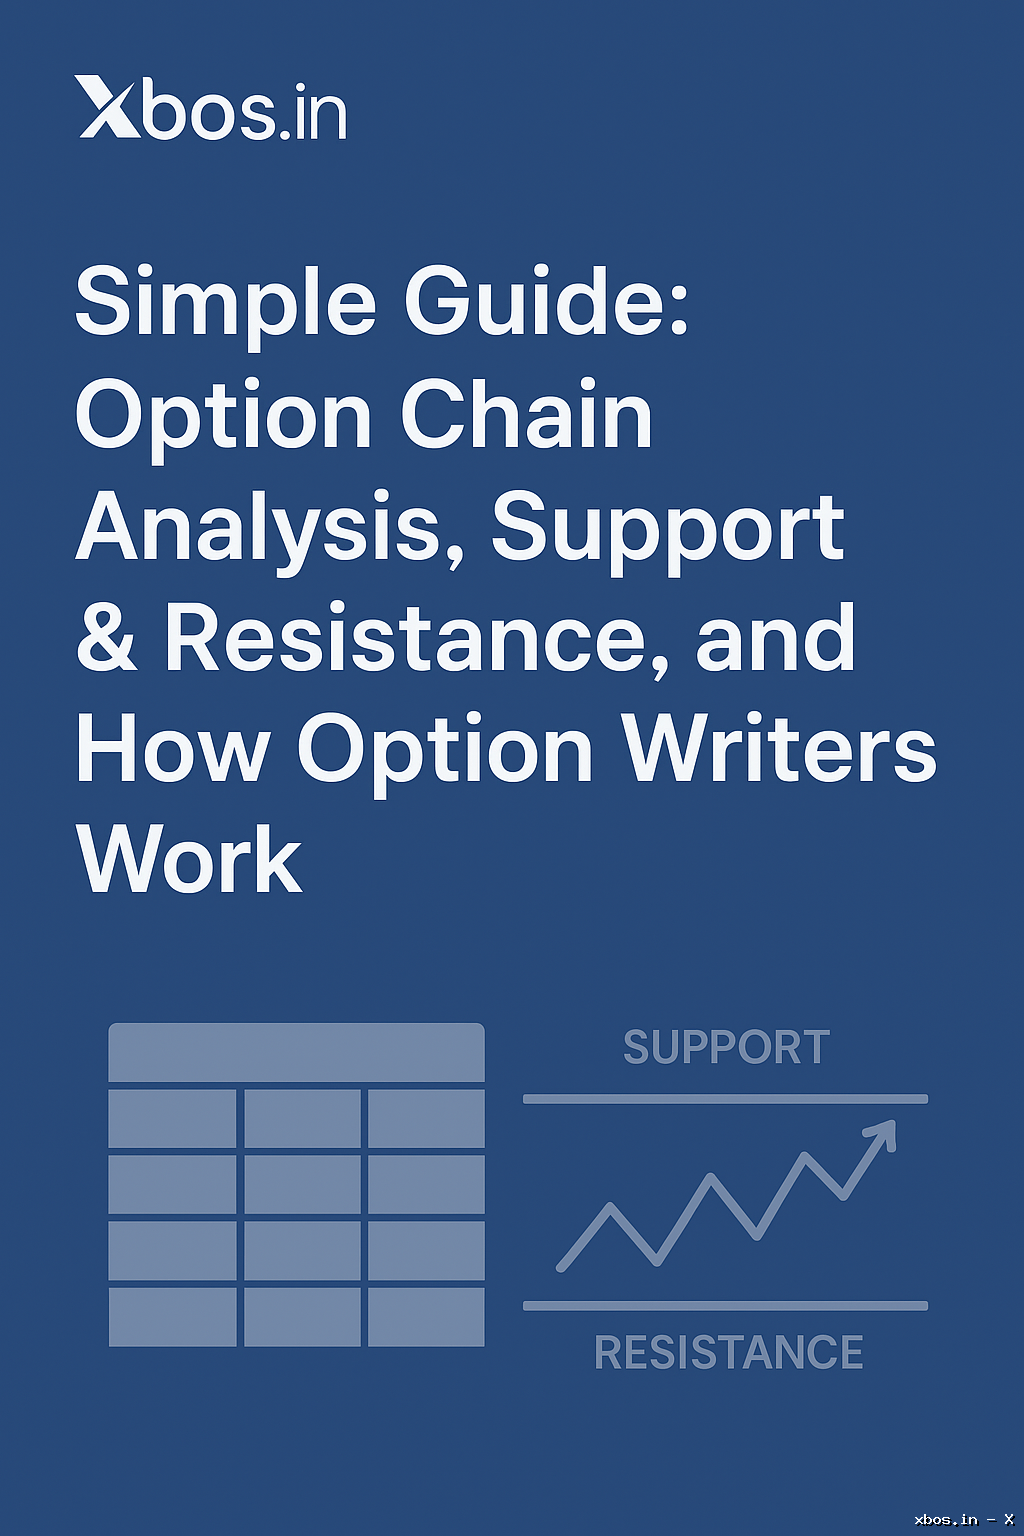
Pre Simple Guide: Option Chain Analysis, Support & Resistance, and How Option Writers Work.
An Option Chain lists all available Call and Put options for a stock or index, showing strike prices, premiums, and open interest. It helps traders analyze support, resistance, and option writer activity. Click on the image to gain deeper insights into the article.
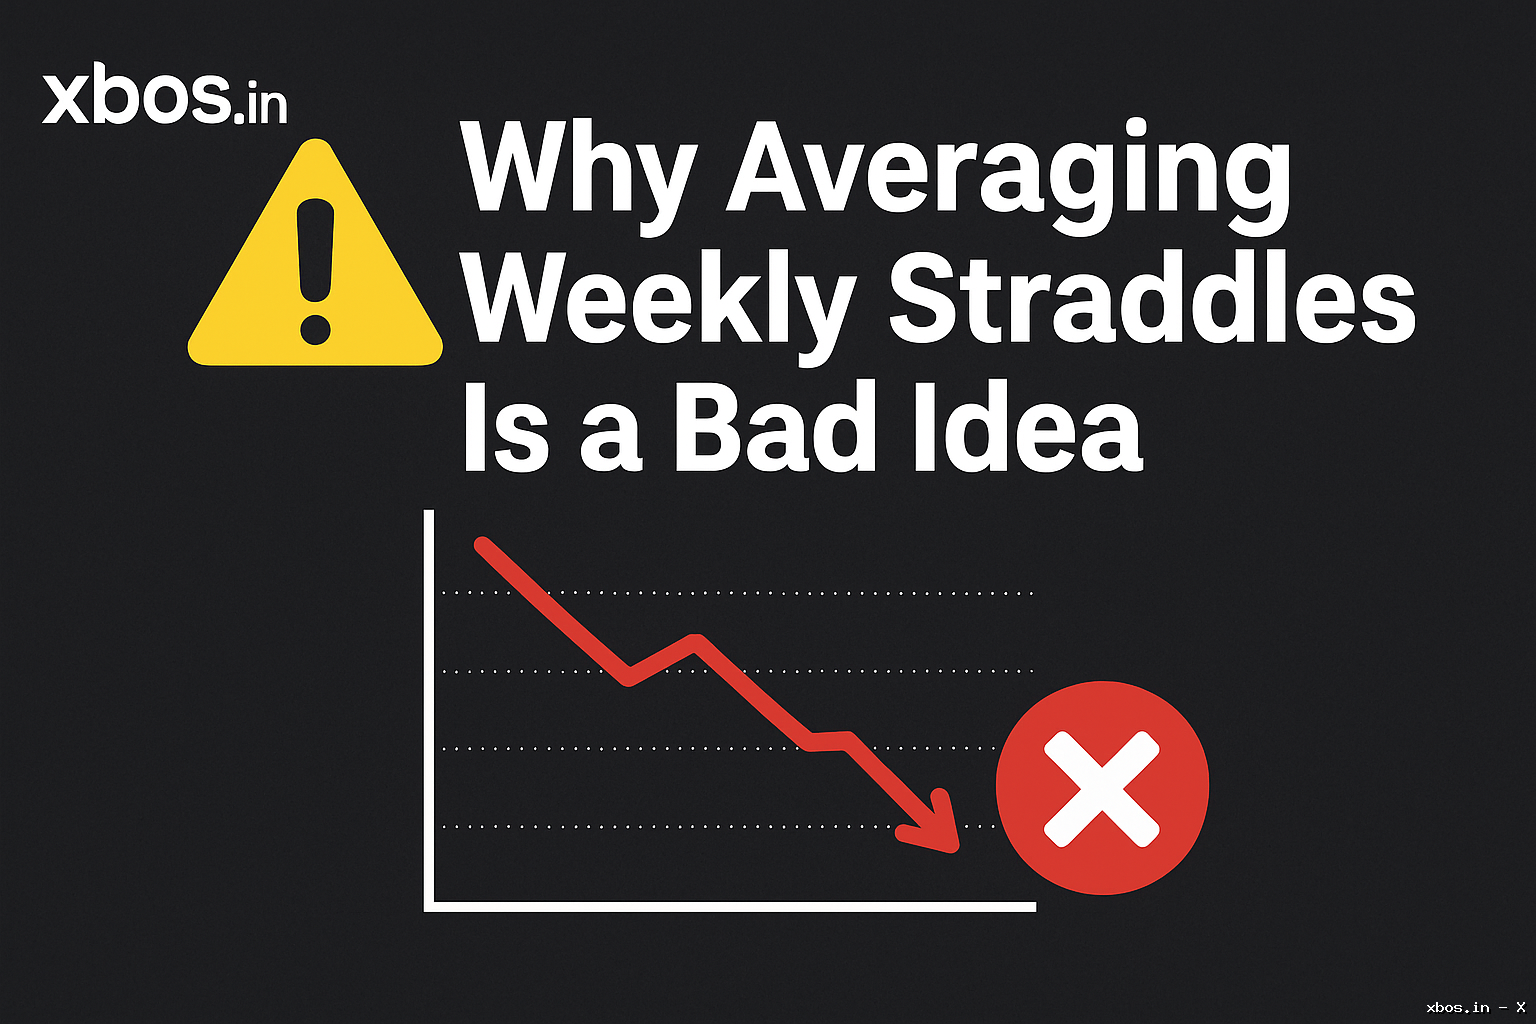
Why Averaging a Weekly Straddle in a Low Volatility Market Can Be a Costly Mistake
In low volatility markets, where price swings are minimal, deploying weekly straddles—especially OTM ones—can backfire. Attempting to average down often leads to mounting losses as both call and put premiums erode. Tap the image to access the article.
Rising Implied Volatility (IV) & Premium Price in Options – What You Must Know
+ Higher IV means the market expects large price swings → Leads to higher option premiums.
– Lower IV indicates smaller expected price movements → Results in lower option premiums. Click the image below to open the article
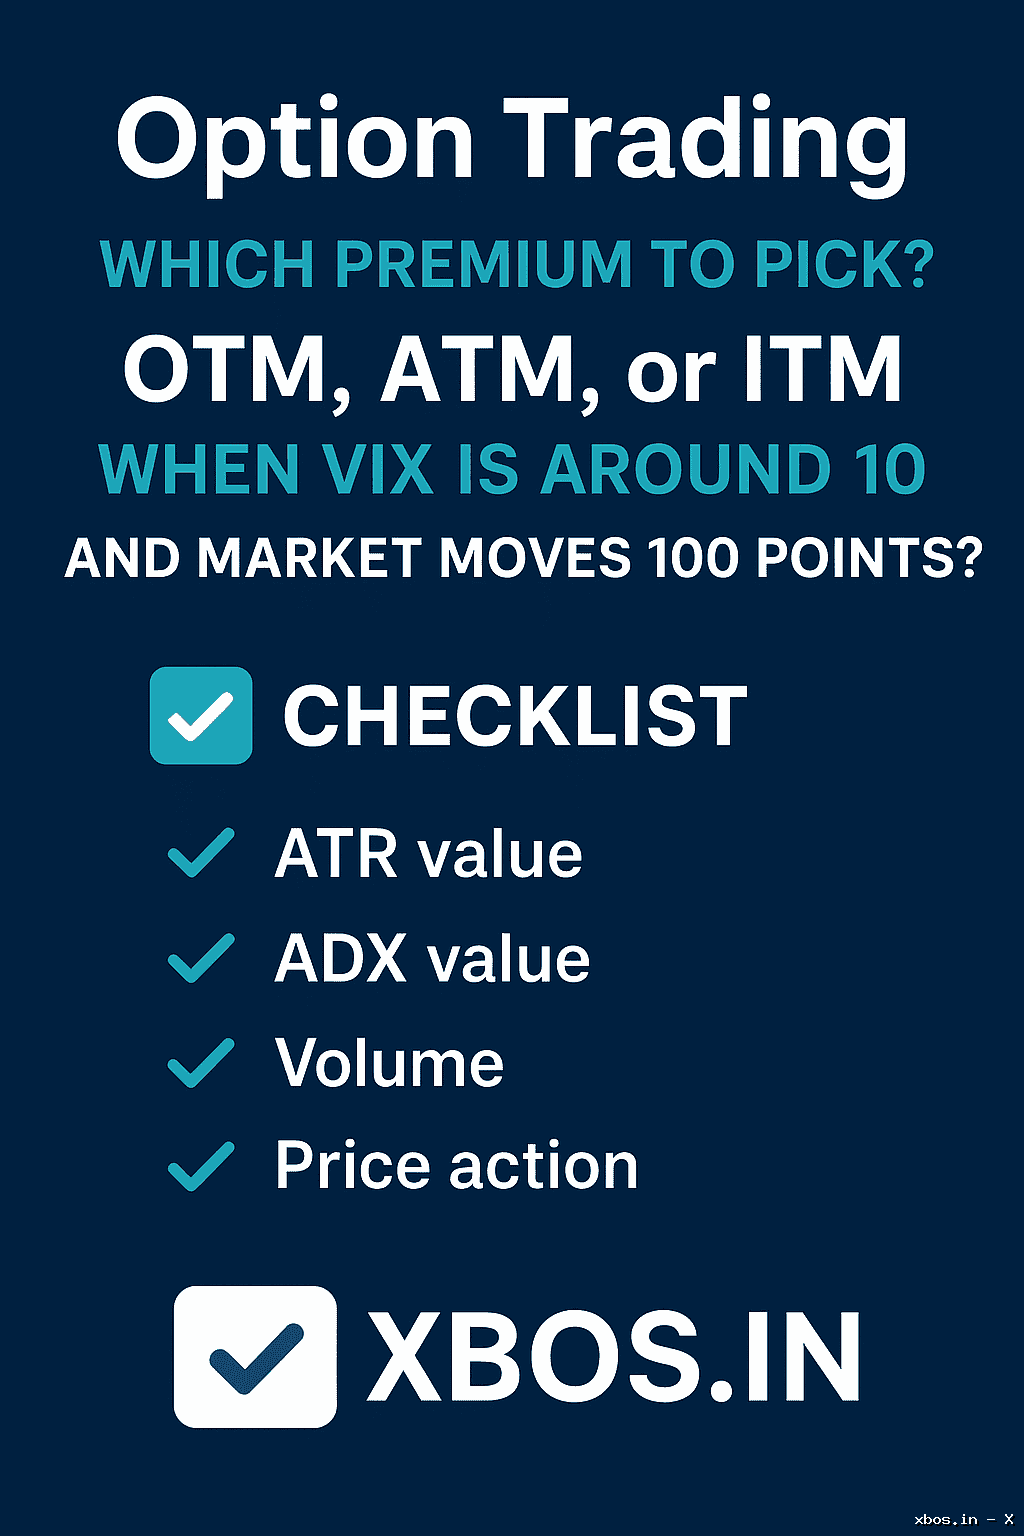
Option Trading: Which Premium to Pick -In today’s low-volatility market, choosing the right option premium—OTM, ATM, or ITM—can make all the difference between profit and loss. This guide helps traders make informed decisions using key indicators like ATR, ADX, volume, price action, and the XBOS indicator. Click on the image to read the article.