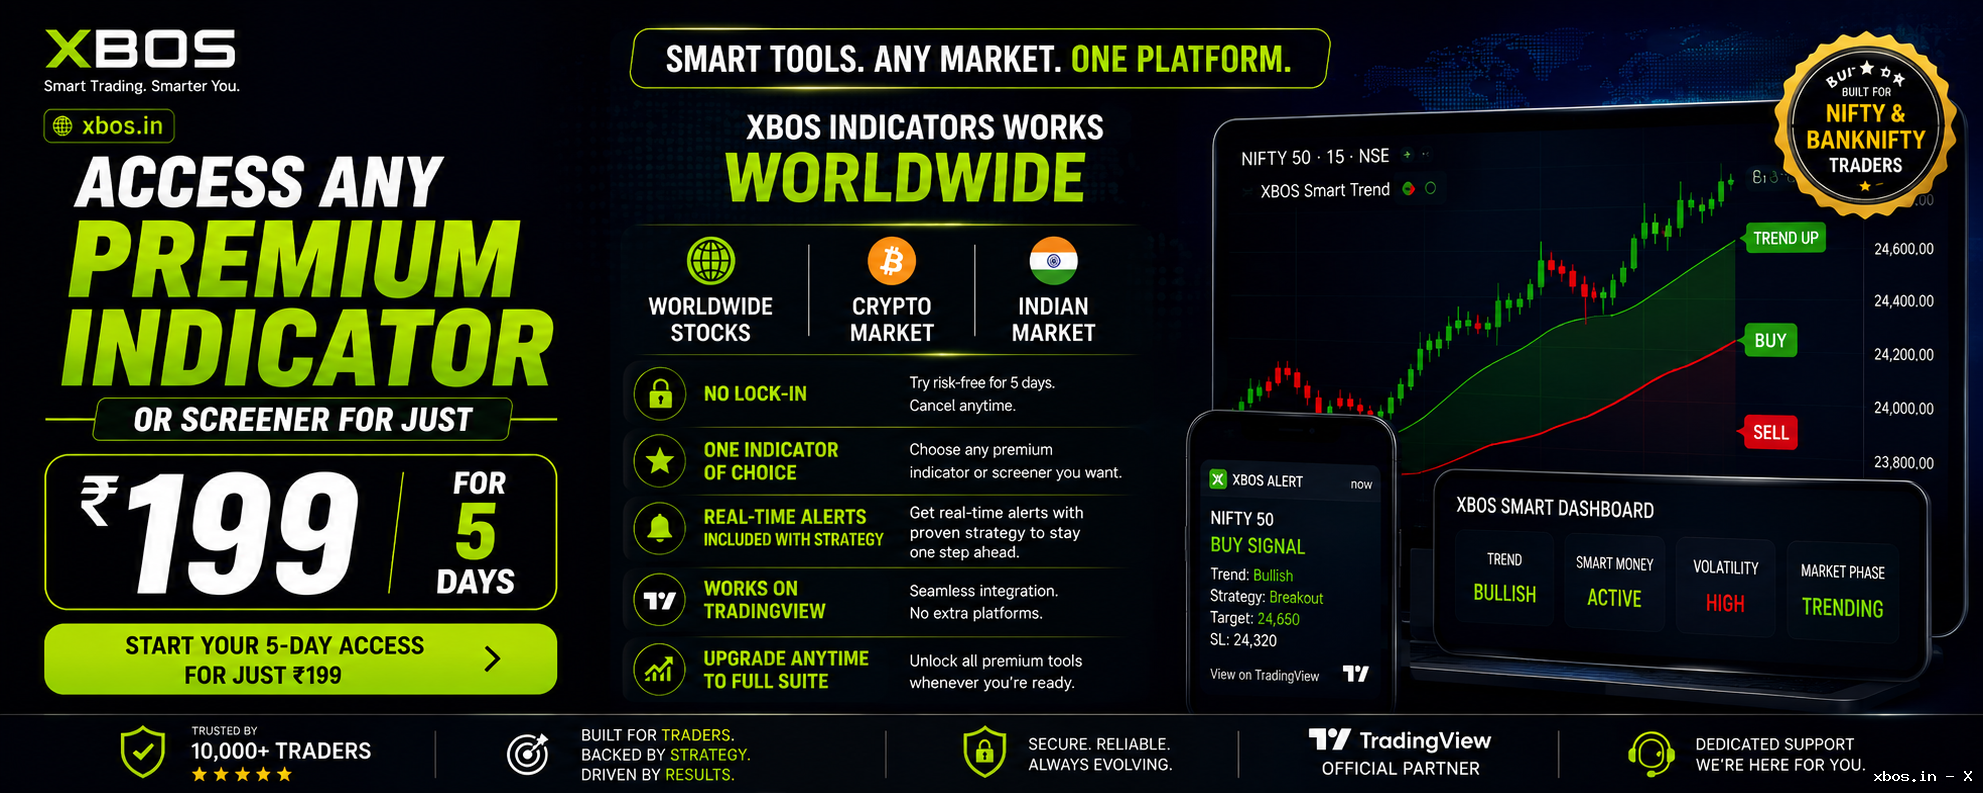
🎯 Precision Trading Signals, Alerts & Strategies
Rule-based insights built on Smart Money, Option Greeks & Volatility Signals, logic. XBOS delivers structured trade setups, instant alerts, and ready-to-use strategies—removing emotion and guesswork from trading.
📈 All-in-One Dashboard Ecosystem
Analyze market structure, volume, volatility, and sentiment—all from one unified interface. Get real-time alerts and strategy-driven dashboards for every market condition.
🇮🇳Tailored for Indian & Global Markets
Optimized for NSE, NIFTY, BANKNIFTY & SENSEX with IST-based data, India VIX, and NSE expiry logic—plus full support for global stocks, currencies, forex, and crypto markets.
Free Trail for One Month
Access all premium dashboards, alerts, and trading strategies for free. Experience clarity, precision, and structure—risk-free for your first month.
✨ Founder – Neha Wadhwa (XBOS.in)
I’m Neha Wadhwa — Founder of XBOS.in and creator of the XBOS Indicator, with 13+ years of experience in wealth management and investment advisory across Motilal Oswal, HDFC Bank, ICICI Bank & IndusInd Bank.
An eMBA from IIFT with NISM and IRDA certifications, I built Xbos.in from real trading lessons to help traders avoid costly mistakes and trade with clarity, discipline and confidence.
🔎 You can verify my professional background anytime on LinkedIn.
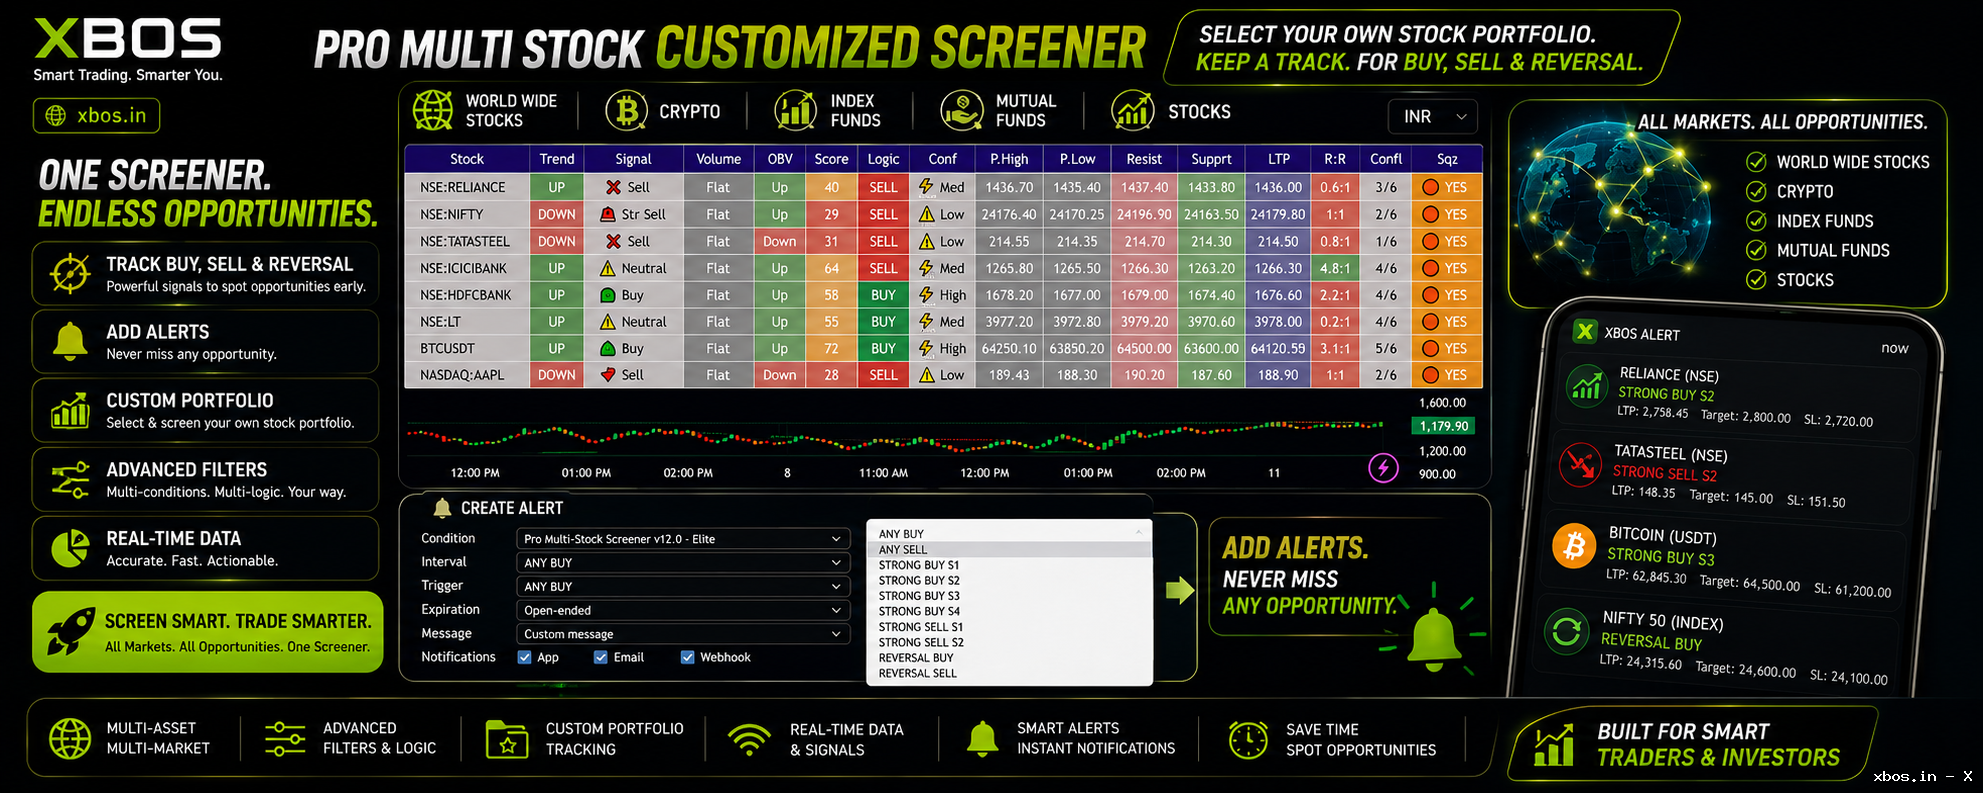
Xbos Stock Scanner
Pro Multi Stock Customized Screener
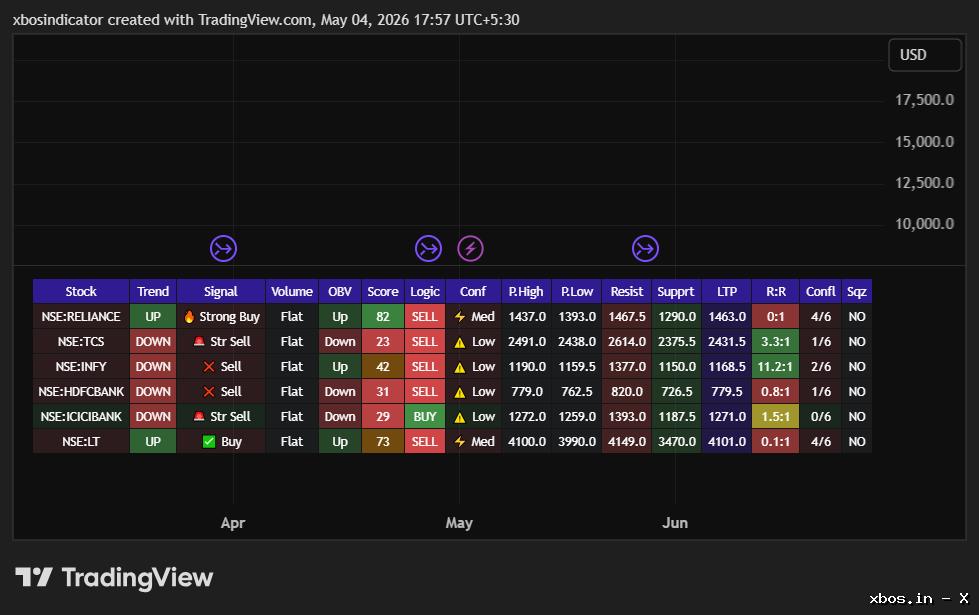
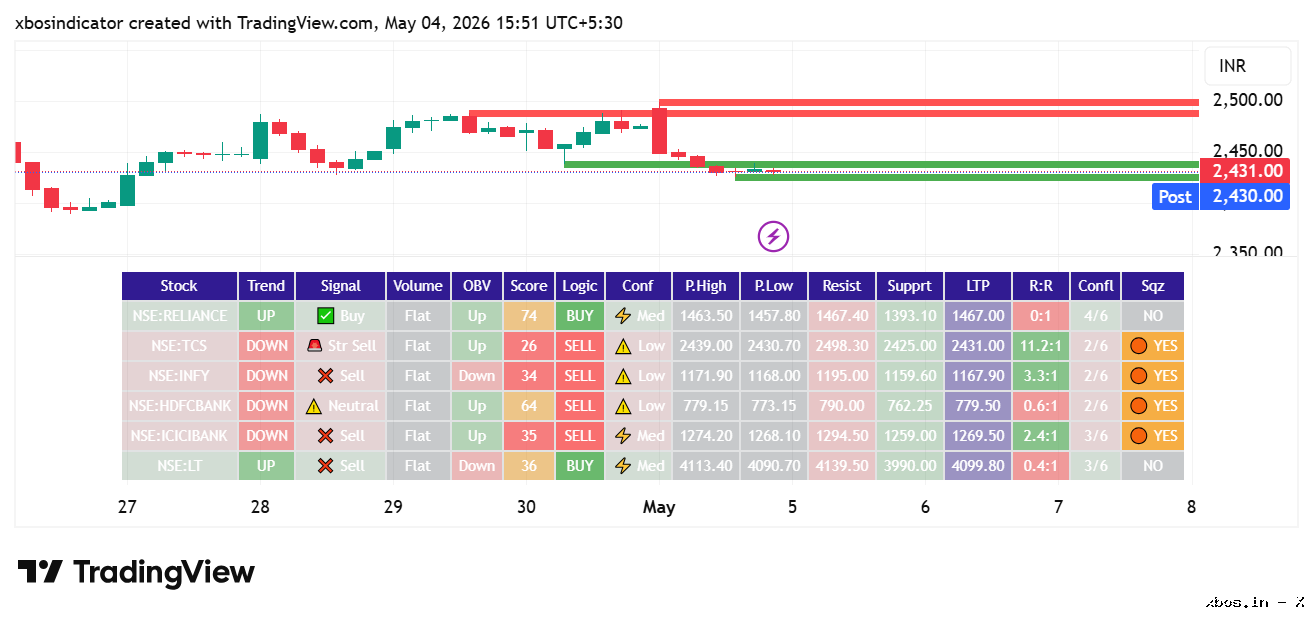
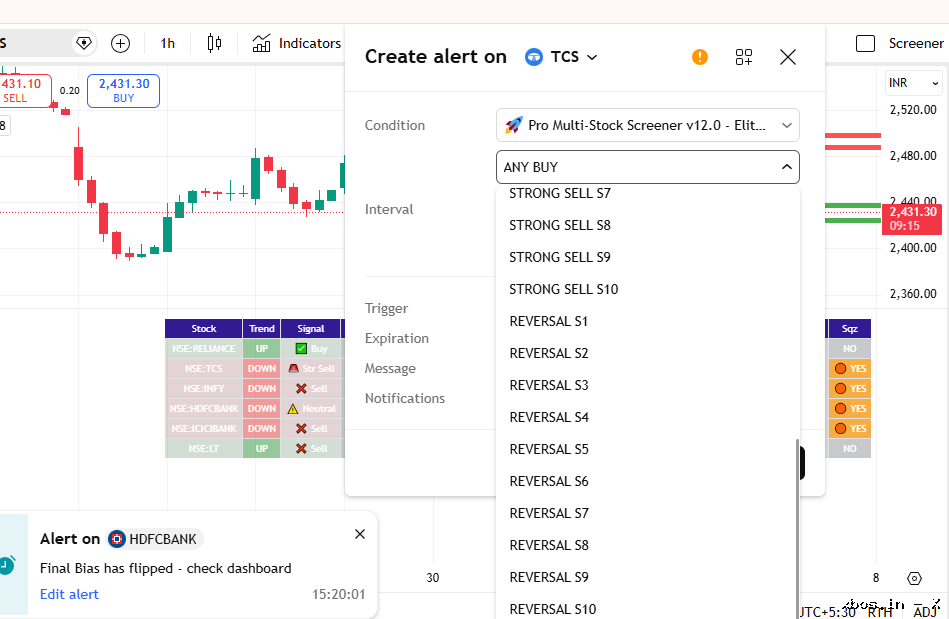
Take control of your investments with a customized TradingView-based screener that works as a full trading terminal—analyzing stocks, indices, crypto, and global markets in one place with live updates.
Get instant buy/sell signals, smart scoring, and real-time market alignment with NIFTY 50 and India VIX—all from a powerful, unified dashboard.
xBOS AI – Momentum Radar Scanner Nifty 50
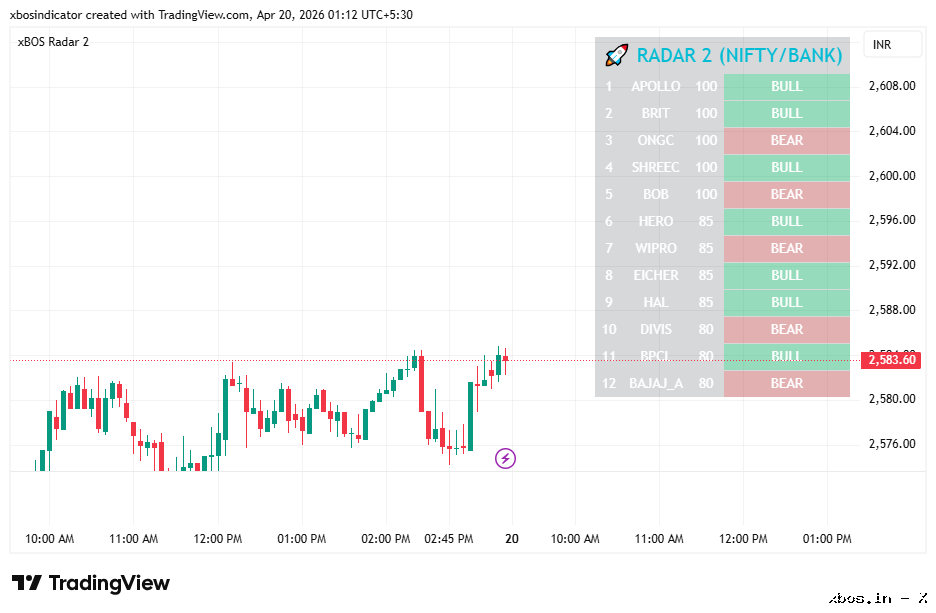
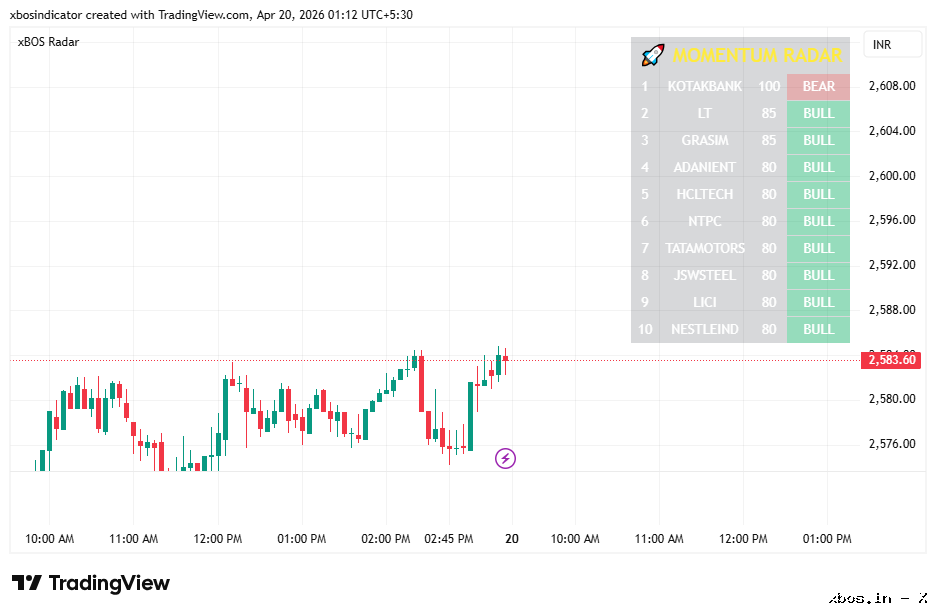
xBOS AI – Momentum Radar is a real-time, multi-factor dashboard that tracks institutional activity across major NIFTY stocks. It combines trend strength, relative performance, volume signals, and breakout detection to identify genuine market participation—delivering a live view of where smart money is flowing. Best setup (professional use):
- Primary (signal detection): 5-minute or 15-minute
- Confirmation (trend strength): 1-hour
- Context (big money direction): Daily
Xbos Momentum Cascade Multi-Index
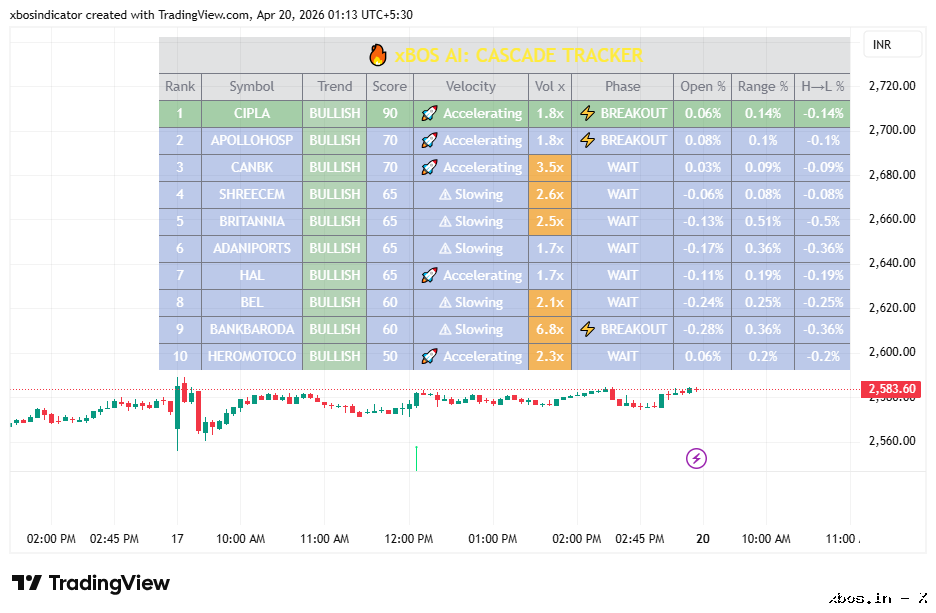
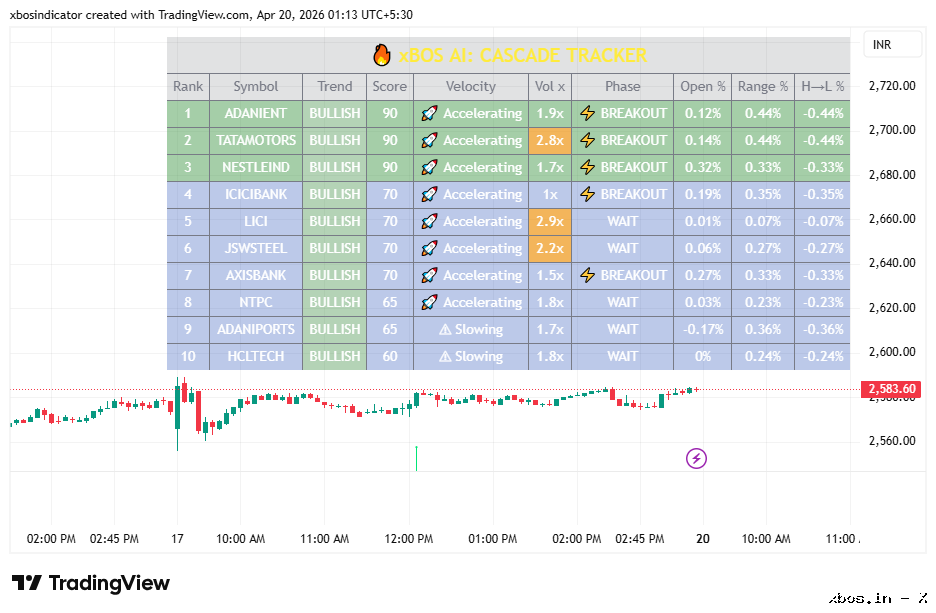
xBOS Momentum Cascade PRO scans NIFTY, Bank Nifty, and Sensex, crypto , currency to spot real-time momentum expansion and breakout setups. It ranks stocks using a momentum scoring model and flags Coiling, Breakout, and Cascade phases along with trend.
Designed for precise early entries—before the crowd, not after the breakout.
xBOS P&L Dashboard PRO ELITE
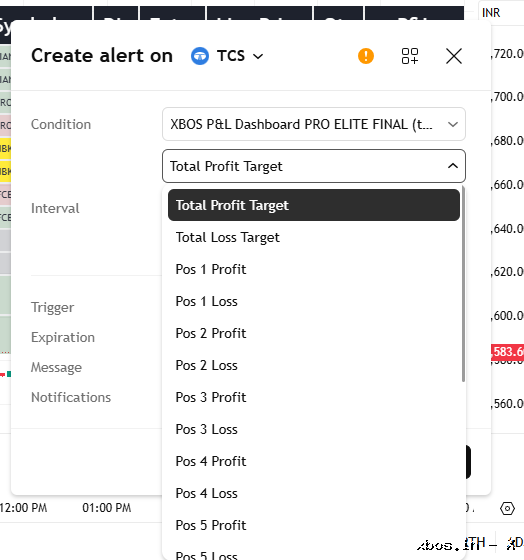
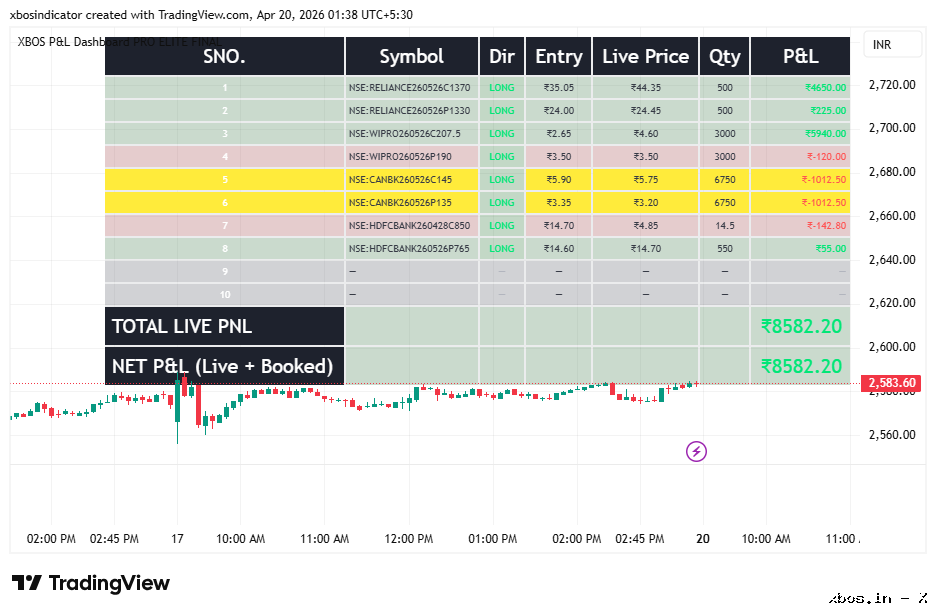
xBOS P&L Dashboard PRO ELITE is a real-time profit & loss dashboard for active traders across Equity, Options, and Indices.
Track and manage multiple positions from one on-chart panel, get instant alerts on your phone when targets or stop-loss are hit, and easily create hedged positions and advanced strategies—all in one system.
Xbos Indicator
📊 Smart Money Concept
Unlock Institutional-Level Precision with XBOS Smart Money Concepts
Experience the full power of the XBOS Smart Money Concept ecosystem — your complete trading edge across any market condition.
🔍 Explore all SMC indicators below to see how each tool strengthens your technical analysis and enhances your trading decisions.
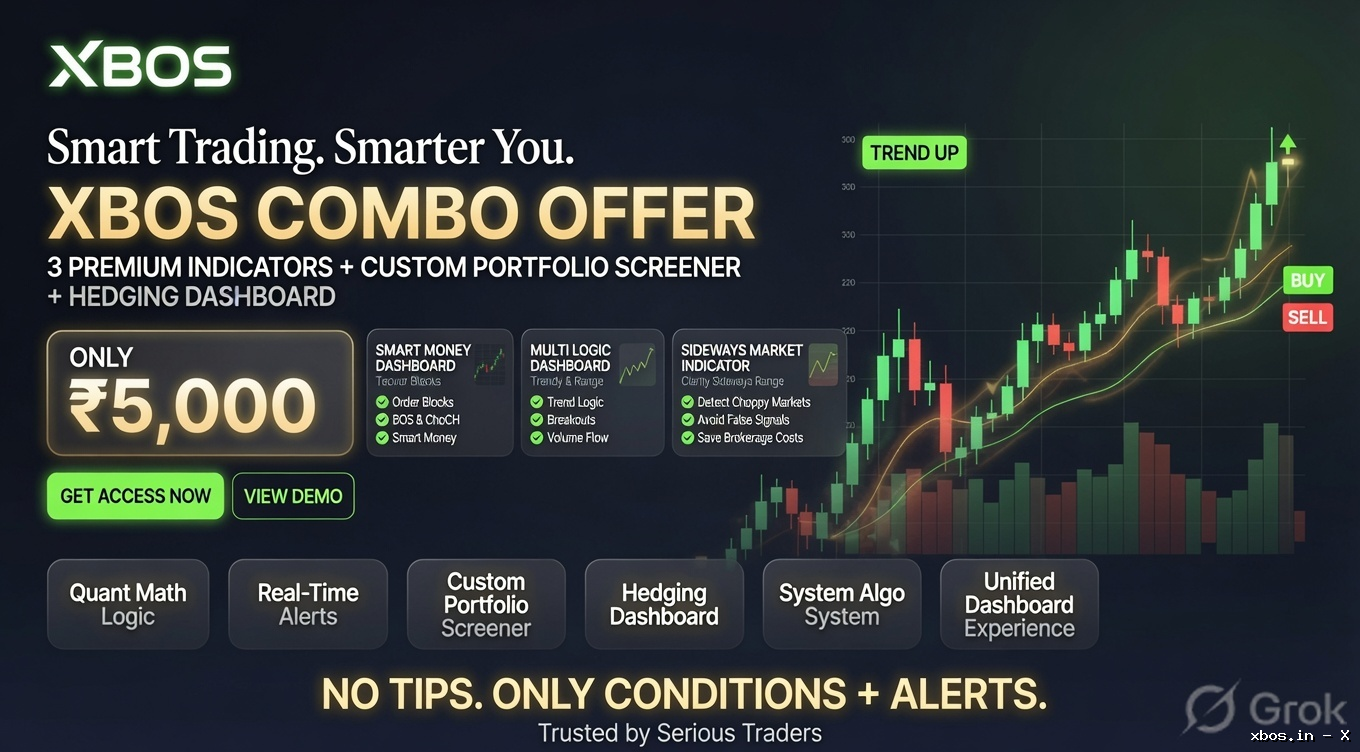
📌 1. Smart Money Dashboard Indicator
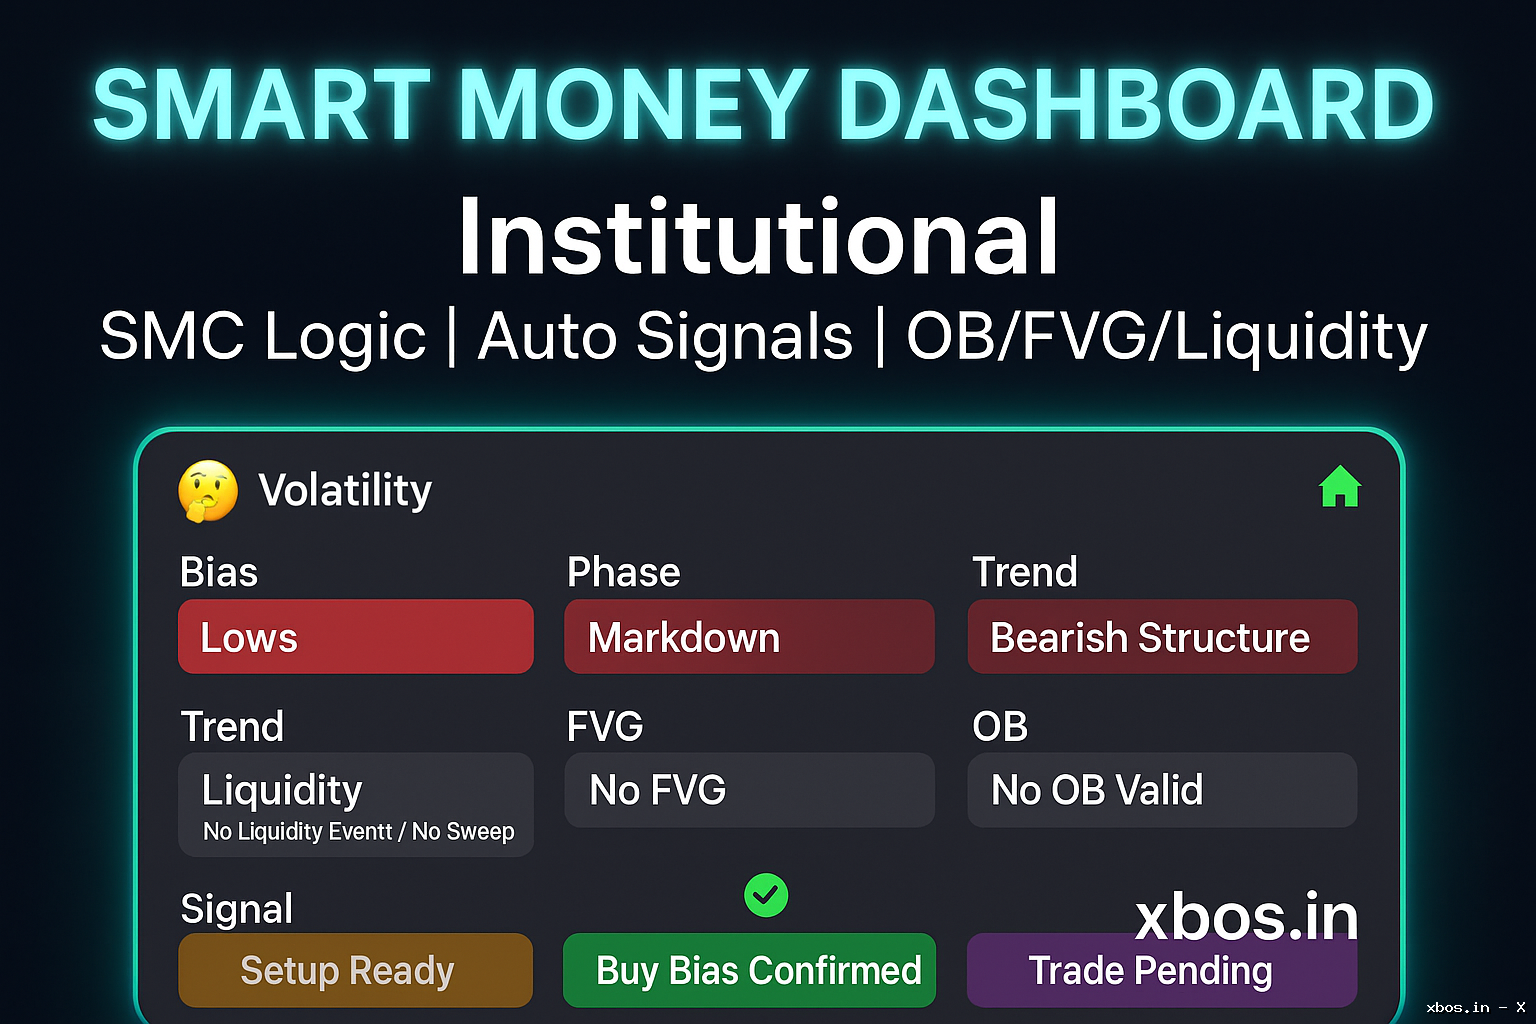
A powerful SMC-based trading dashboard that detects order blocks, FVGs, BOS/CHoCH, and liquidity shifts in real time. Filters false signals, shows clear market direction, and gives precise buy/sell alerts for scalping, intraday, and swing trading.
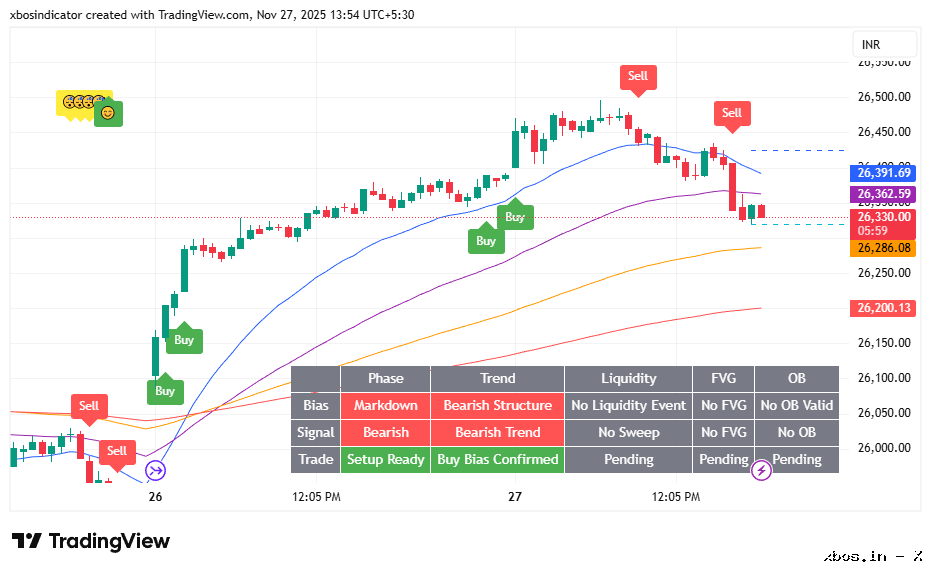
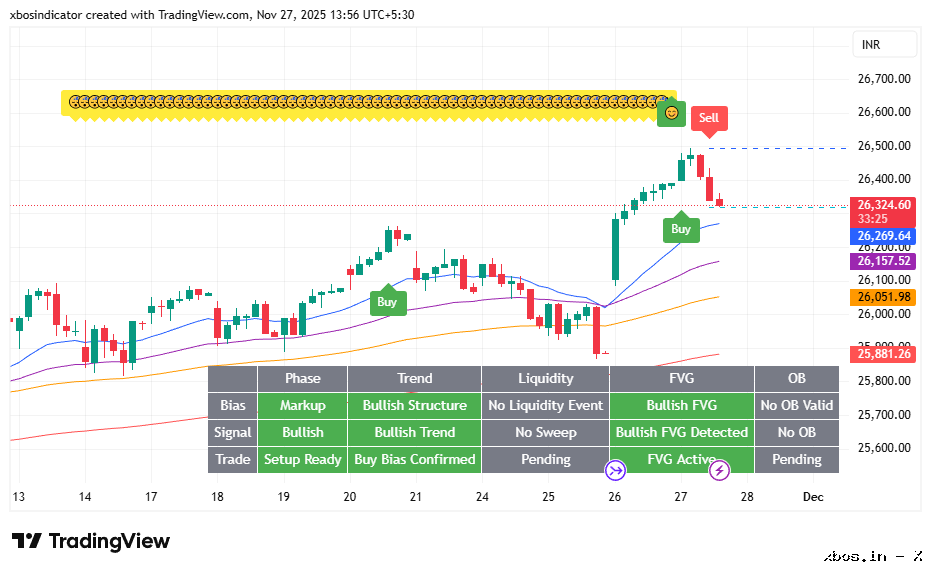
📌 2. SMC Market Structure Indicator
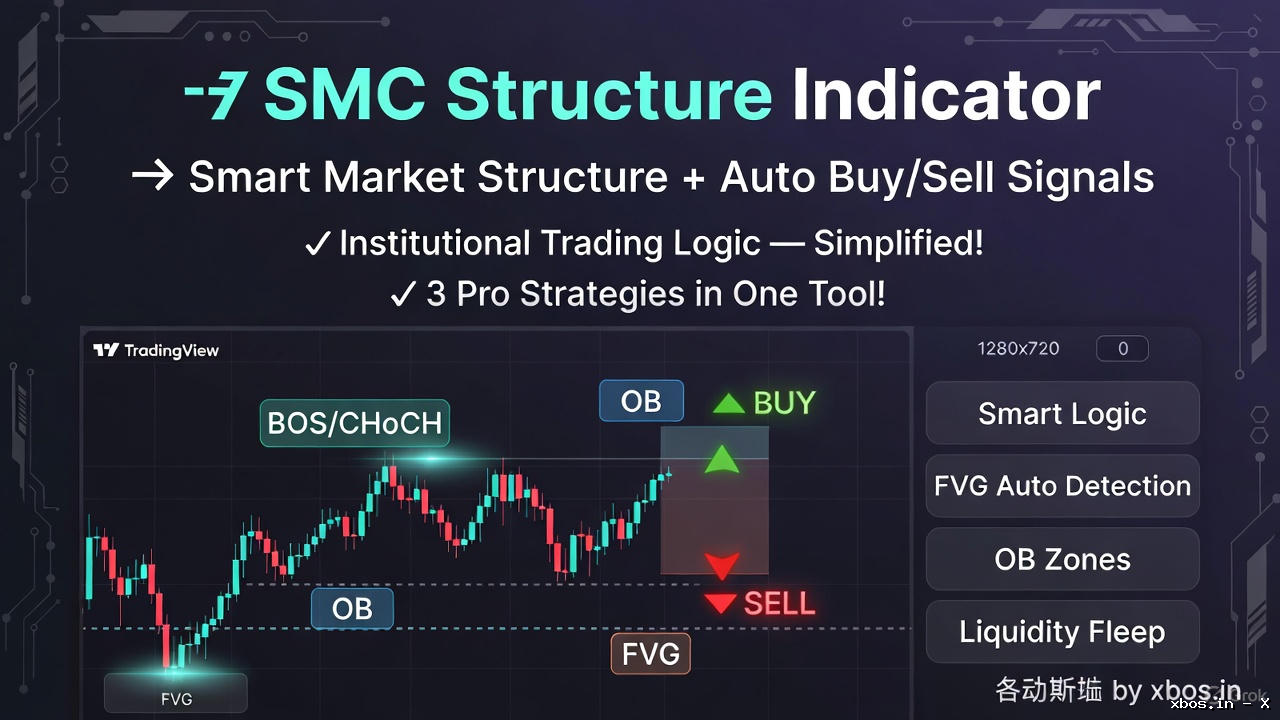
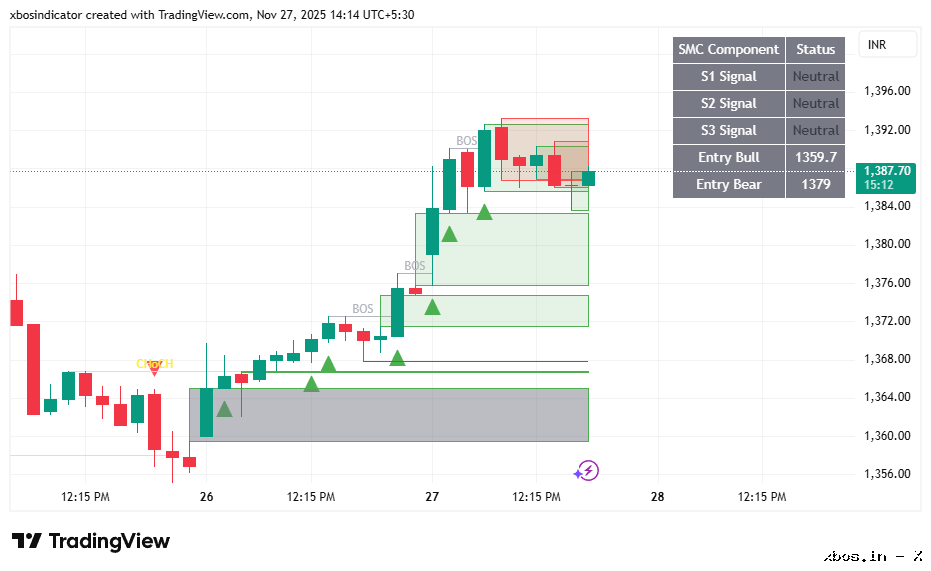
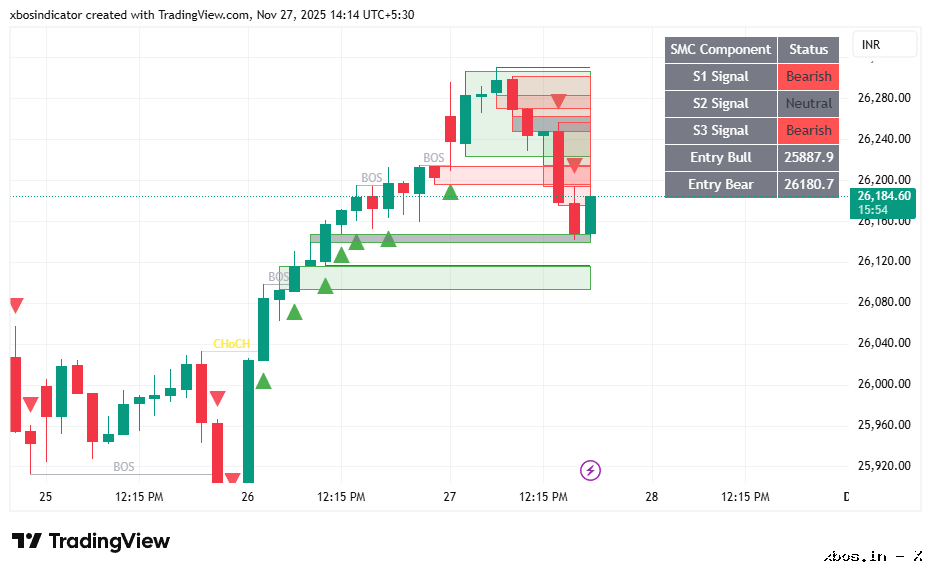
An advanced market-structure tool that highlights BOS/CHoCH, Order Blocks, FVGs, and high-probability SMC setups. It delivers smart buy/sell alerts, filters market noise, and includes three institutional trading strategies—FVG reversal breakouts, liquidity-sweep entries, and BOS/FVG trend-continuation signals—for accurate decision-making across all markets.
📊 Trend & Market Profile Tools
Get powerful market-reading tools from xbos.in using the advanced XBOS Indicator suite. These premium dashboards combine trend analysis, Fibonacci zones, volume profile, and market profile to help you identify high-probability setups, key levels, and true market direction across stocks, equities, Nifty 50, Bank Nifty, forex, and crypto.
1. All-in-One Trading Indicator
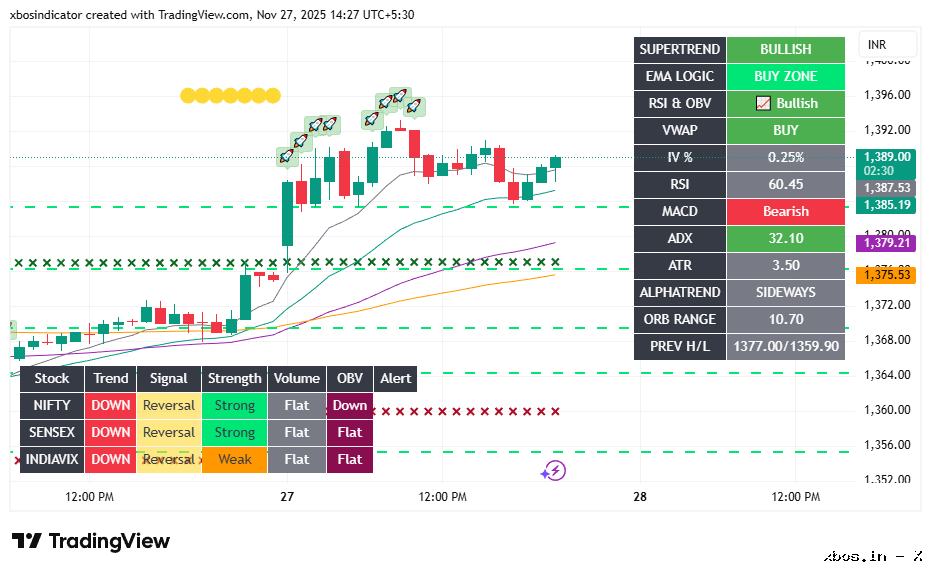
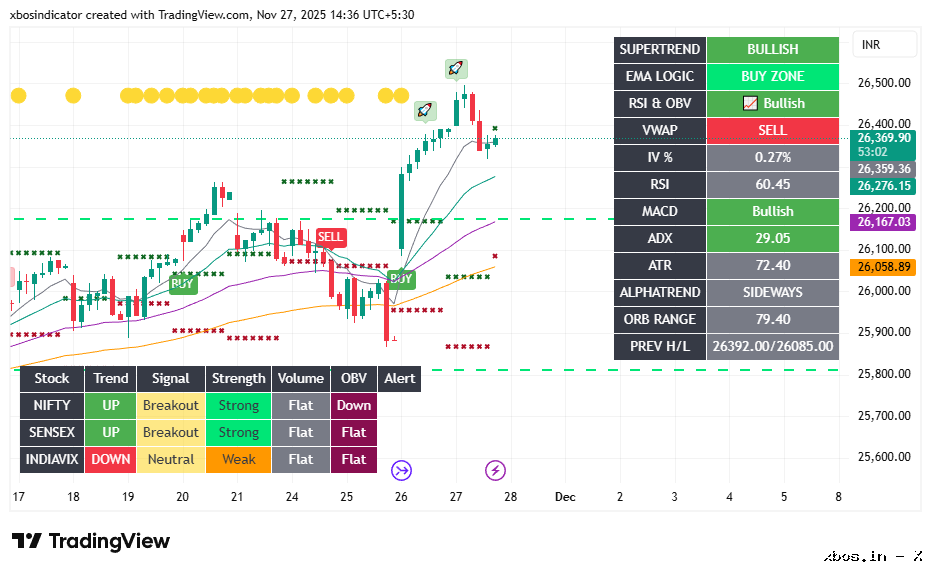
A fast, professional trading dashboard from xbos.in, powered by the XBOS Indicator, designed to simplify intraday and swing trading. It includes Opening Range Breakout (ORB) levels, previous high/low zones, dual dashboards, volume-based signals, breakout detection, and multiple alert strategies—helping traders find clean entries across stocks, Nifty 50, Bank Nifty, equities, forex, and crypto with clarity and precision
2.Market Profile Dashboard
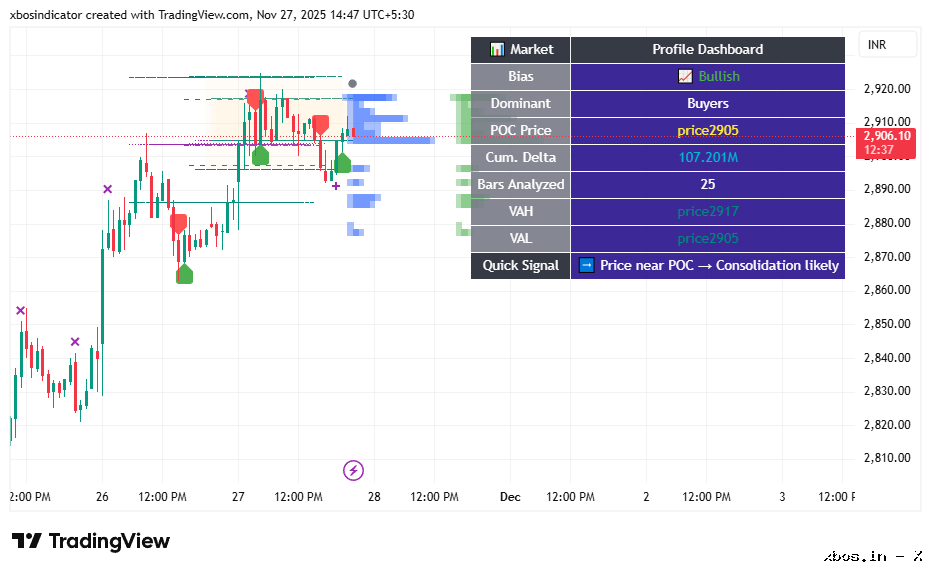
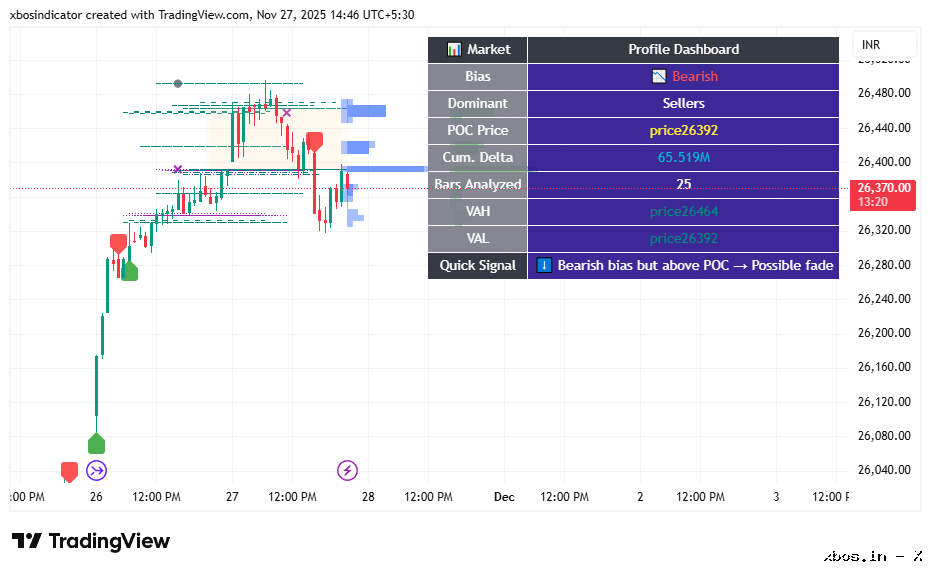
The Market Profile Dashboard from xbos.in is a powerful advanced tool that blends Volume Profile, Money Flow, and Cumulative Delta into one clean, professional interface. It helps traders instantly spot high-probability zones, market bias, POC shifts, and breakout opportunities with clarity.
With automatic POC & Value Area tracking, real-time trade alerts, and high-volume zone markers, this dashboard is ideal for intraday and swing traders looking to identify support/resistance levels, trend changes, and momentum surges across Nifty 50, Bank Nifty, stocks, indices, forex, and crypto.
3. Auto Trendline & Open Interest Heatmap Indicator
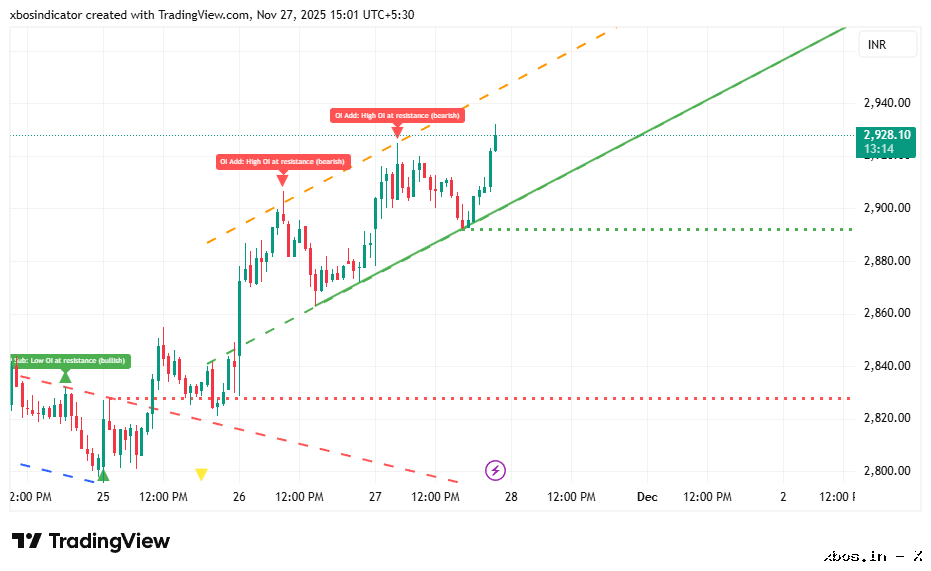
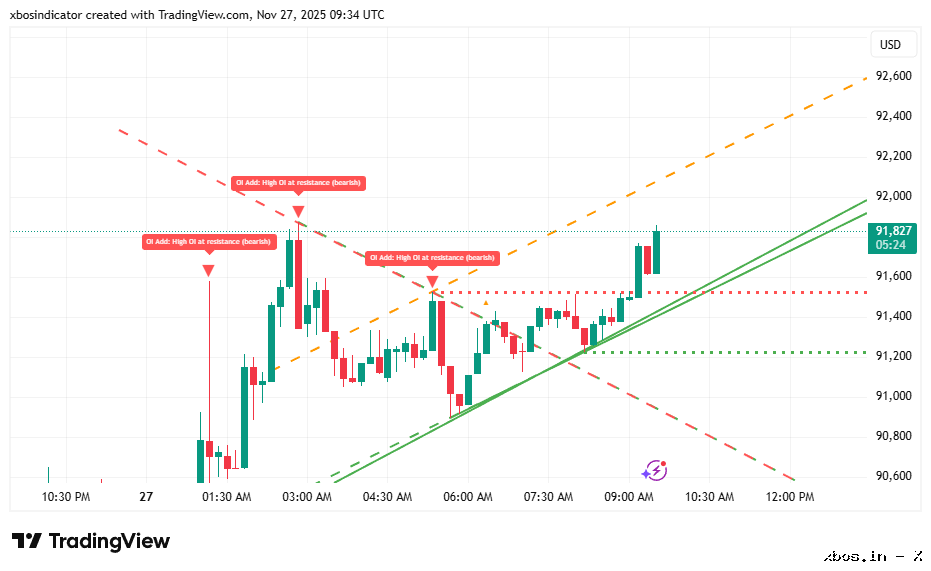
The Auto Trendline & Open Interest Heatmap Indicator from xbos.in is a smart, AI-driven market-structure tool that automatically detects trendlines, support/resistance zones, and price channels — all updated in real time. Enhanced with Open Interest (OI) heatmaps, volume analysis, and breakout validation, it helps traders identify genuine moves, avoid fakeouts, and trade with higher confidence across stocks, Nifty/Bank Nifty, options, forex, and crypto.
4.Dynamic Support and Resistance Levels (Auto S/R + Flip Zones)
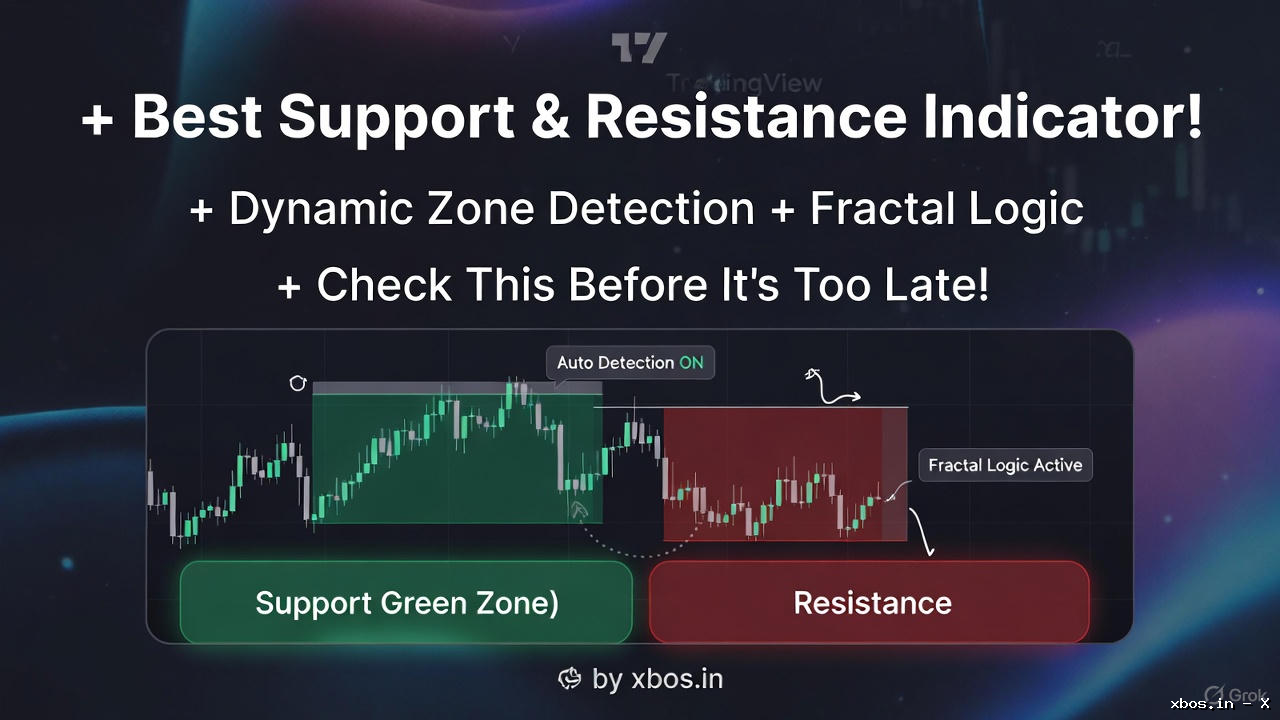
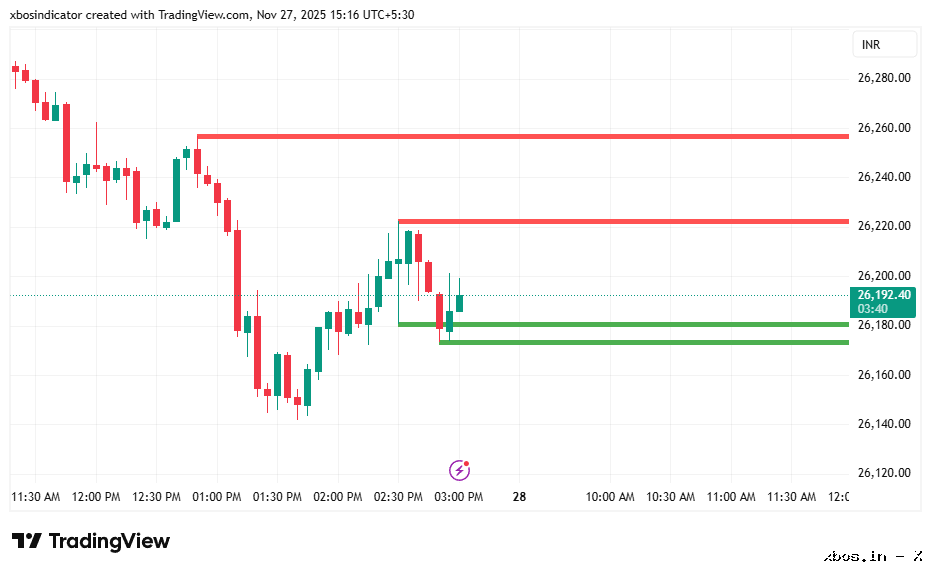
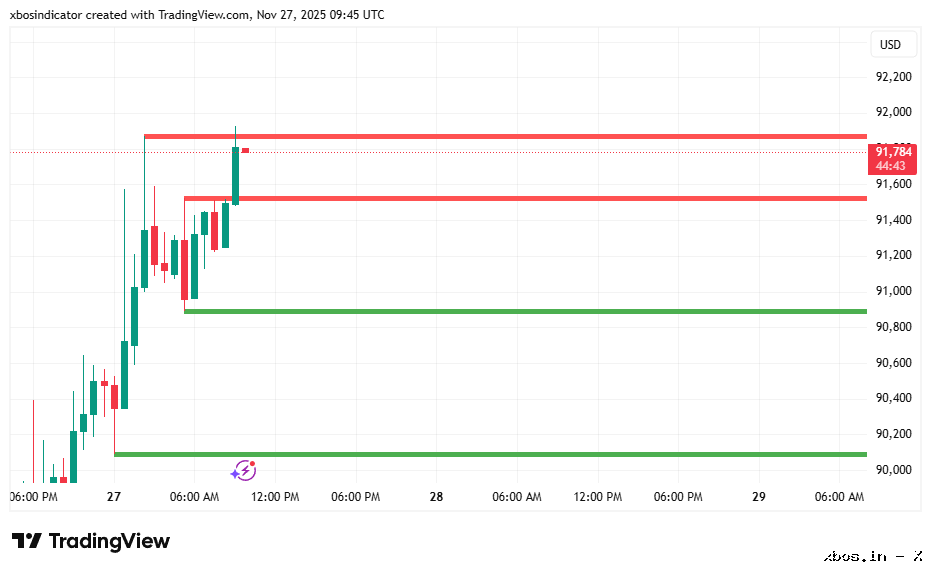
A powerful auto Support & Resistance + Flip Zones indicator for TradingView that updates levels in real time using fractals, breakouts, retests, and market reactions. It removes outdated zones, highlights strong price levels, and adapts to volatility so traders always see the most accurate and reliable market structure — perfect for breakout, reversal, and trend-continuation trading.
📊Option Greeks & Volatility Signals
The Greek Universal Blast Dashboard is a real-time options trading signal system that detects volatility spikes, momentum blasts, Bullish Blast breakouts, and Bearish Blast breakdowns using Delta, Gamma, Vega & IV analytics. Powered by ADX + Choppiness filters, it delivers high-accuracy long and short trade setups across NIFTY, BANKNIFTY, global indices, stocks & crypto—ideal for traders seeking precision entry and exit signals on TradingView.
1.Greek Universal Blast Dashboard
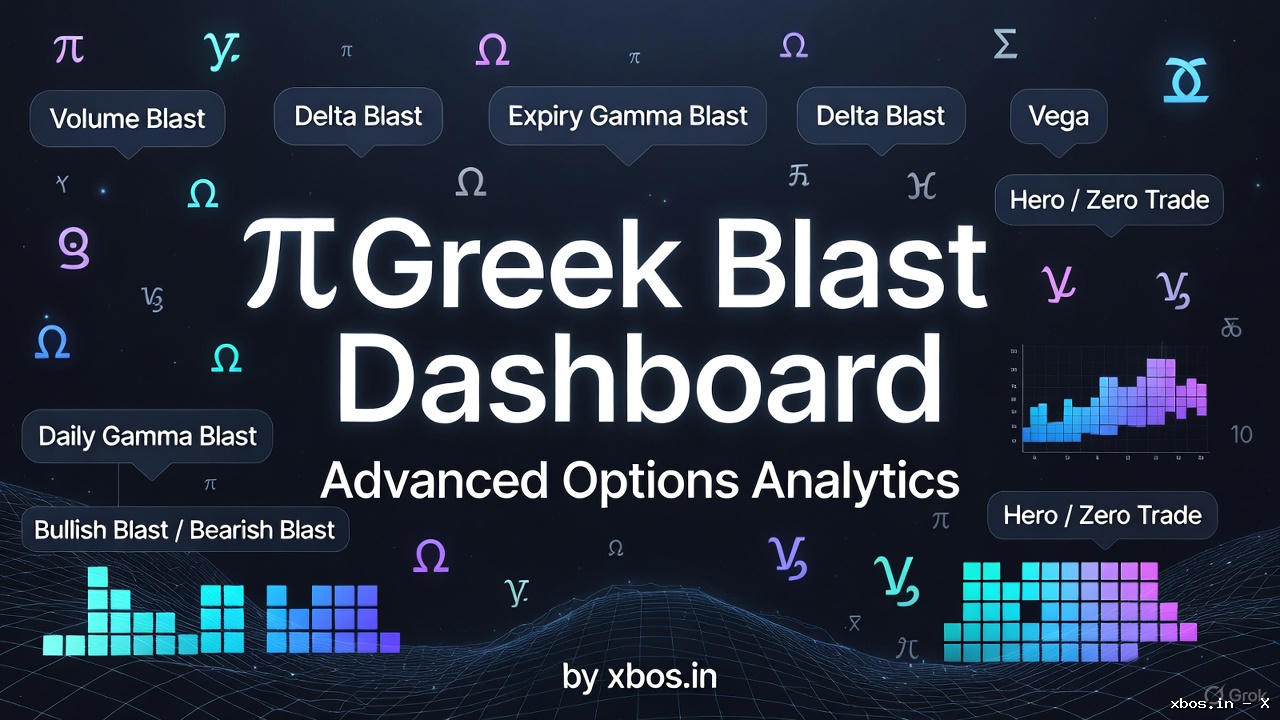
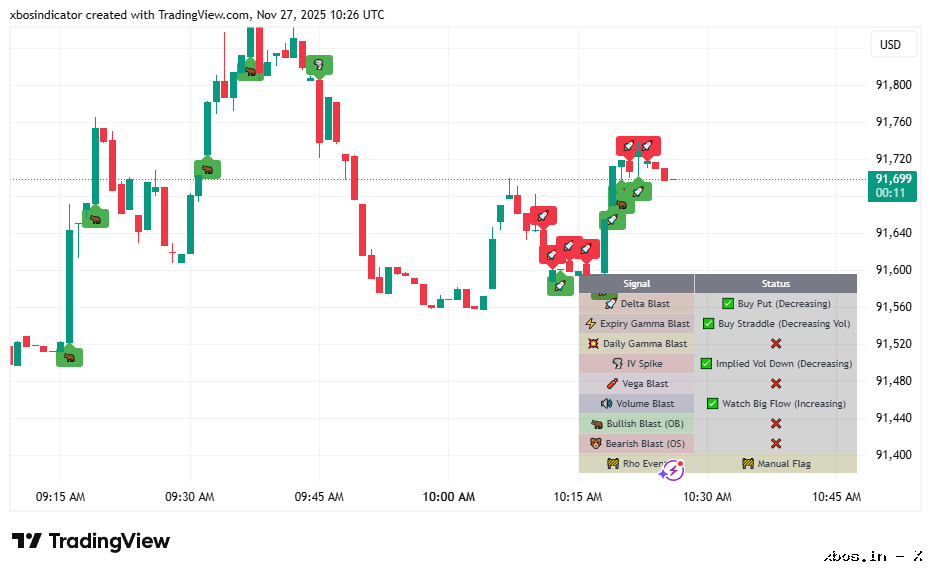
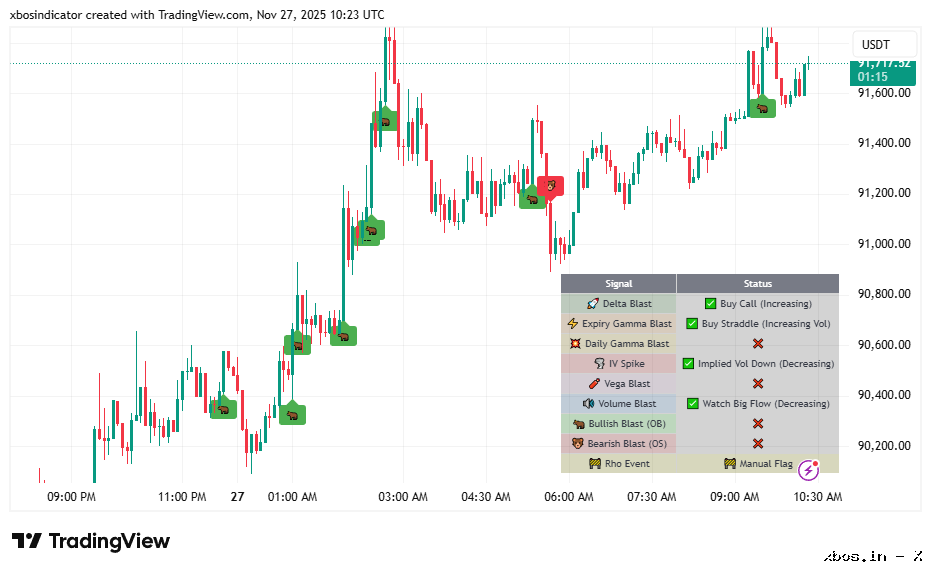
The Greek Universal Blast Dashboard is a real-time options trading signal system that detects volatility spikes, momentum blasts, Bullish Blast breakouts, and Bearish Blast breakdowns using Delta, Gamma, Vega & IV analytics. Powered by ADX + Choppiness filters, it delivers high-accuracy long and short trade setups across NIFTY, BANKNIFTY, global indices, stocks & crypto—ideal for traders seeking precision entry and exit signals on TradingView.
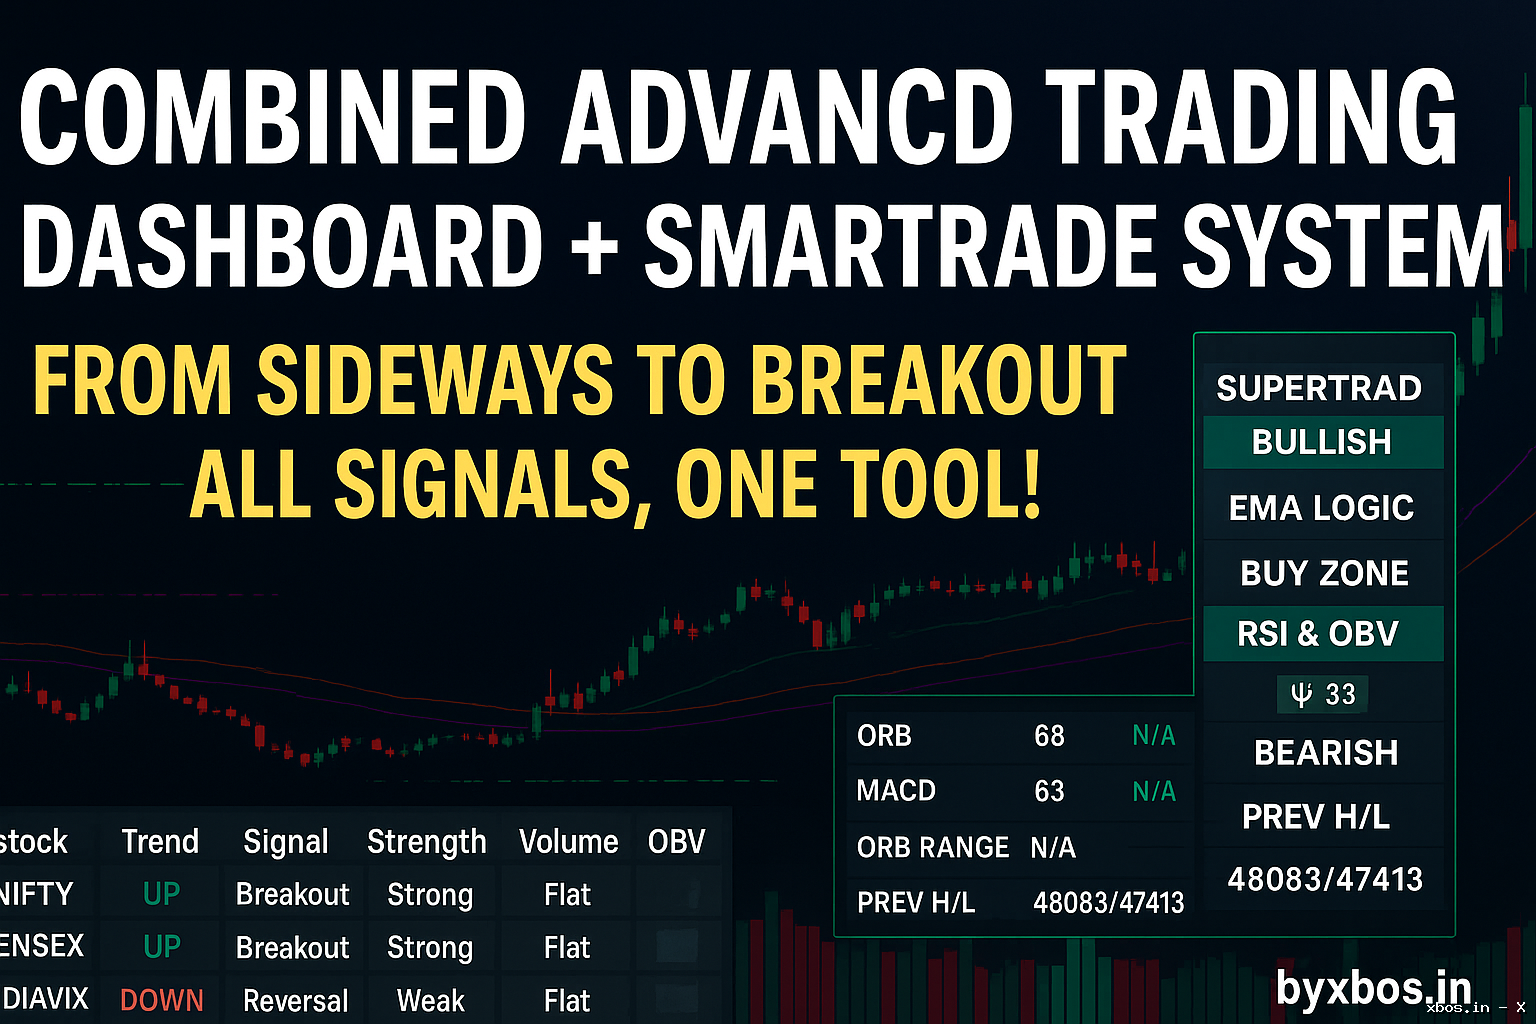
📊Technical Dashboards
At XBOS (xbos.in), our XBOS Indicators Technical Dashboards are advanced TradingView tools that simplify market analysis and deliver clear, actionable trading signals in real time.
The Multi-Logic Dashboard combines trend structure, EMAs, momentum, volume, breakout logic, and Fibonacci levels in one system with smart alerts.
The Multi-Timeframe Dashboard scans 7 timeframes at once to detect trends, patterns, and breakout zones across stocks, forex, crypto, and indices.
The Fibonacci Dashboard auto-plots retracement and extension levels, highlights market structure, and marks key pullback or breakout zones with color signals.
Together, these XBOS Dashboards form an all-in-one market analysis suite, helping traders identify opportunities faster and trade with confidence.
1. Auto Fibonacci Retracement & Extension Tool with Dashboard
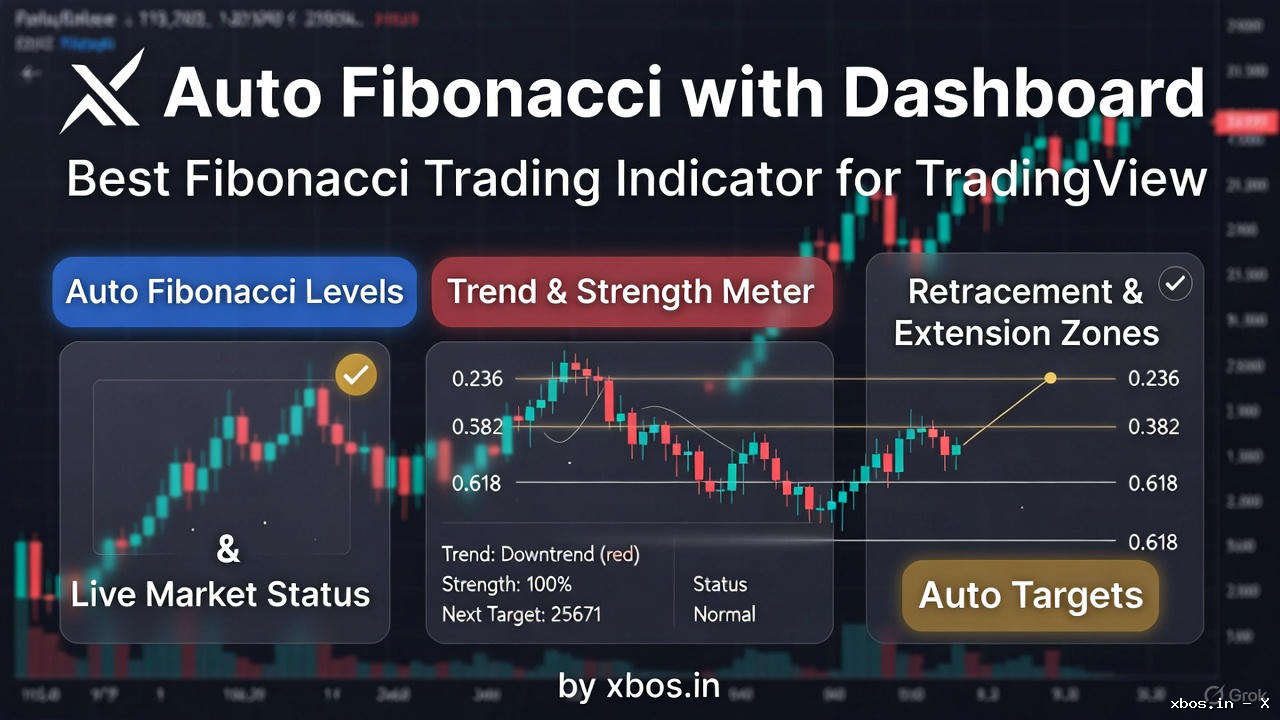
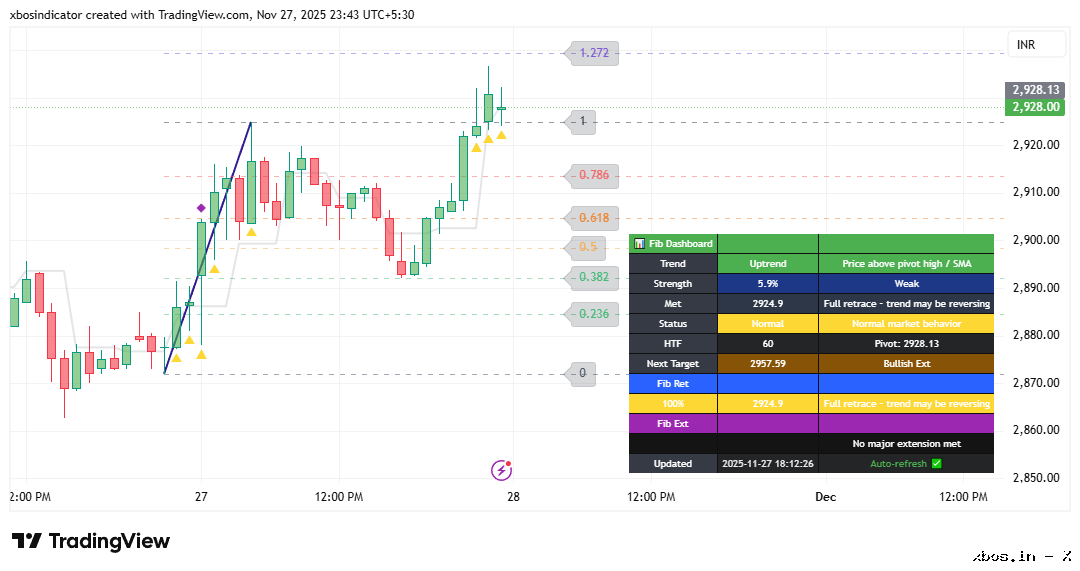
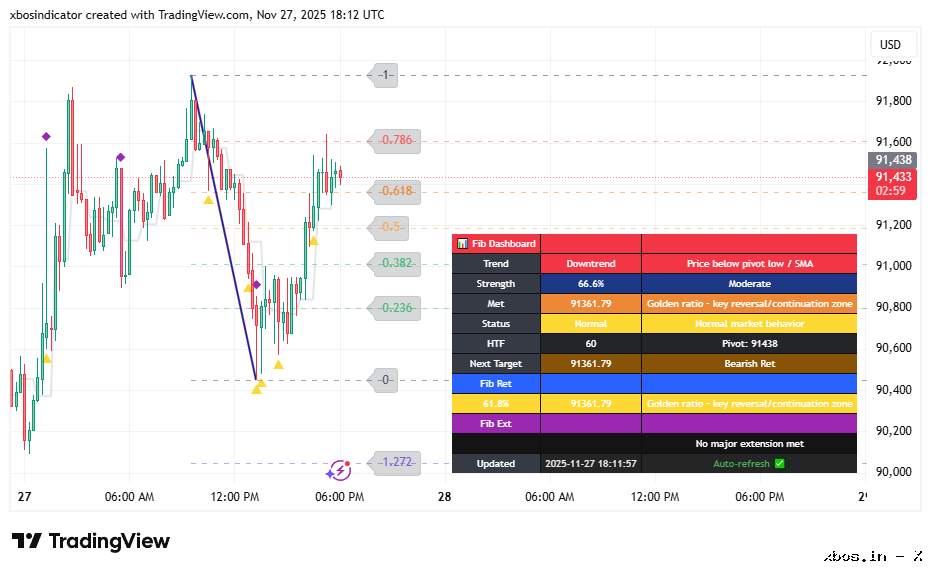
The XBOS Auto Fibonacci Retracement & Extension Tool on xbos.in is a powerful TradingView indicator that automatically detects market trends and plots key Fibonacci levels in real time. Its color-coded dashboard clearly displays whether the market is in an uptrend, downtrend, or neutral phase, along with the last Fibonacci level touched and the current market structure. Built-in alerts notify traders when price approaches major Fibonacci levels such as 0.382, 0.618, 1.272, and 1.618, ensuring no pullback or breakout opportunity is missed. Fully customizable and powered by XBOSIndicator, this tool helps traders analyze faster, plan entries and exits with precision, and make smarter trading decisions confidently.
2. Multi-Timeframe Technical Analysis Indicator Dashboard
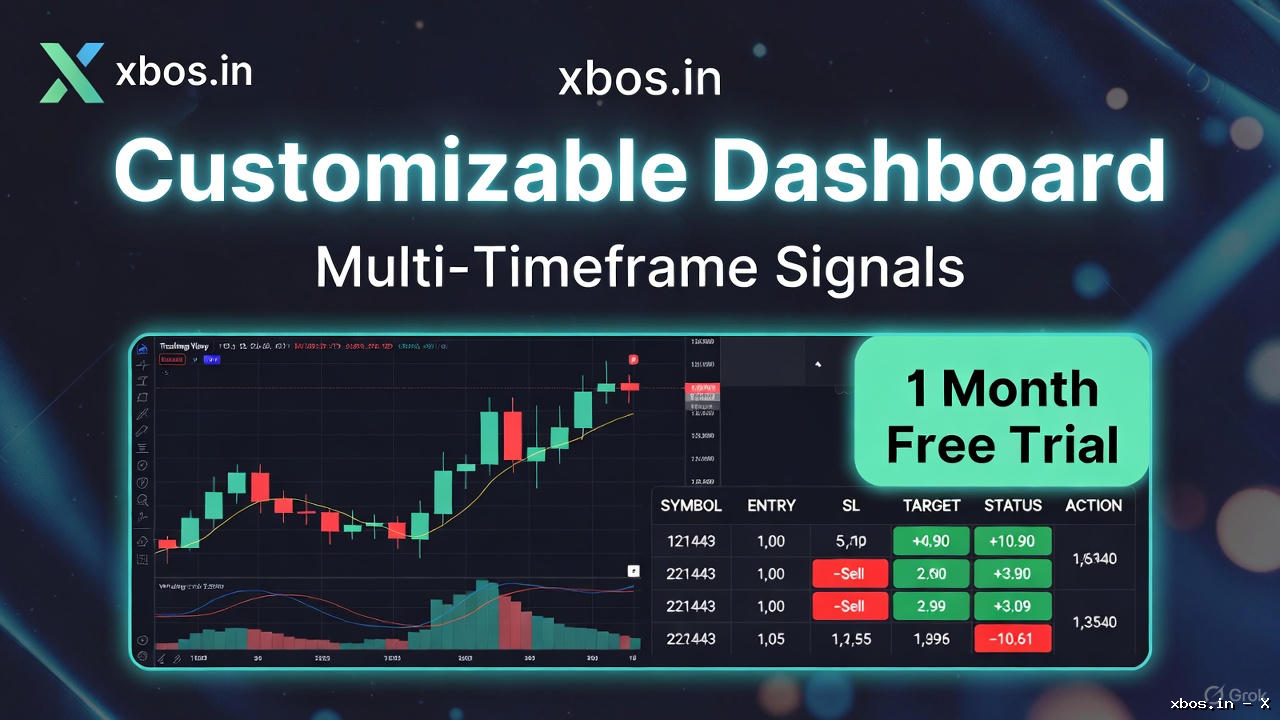
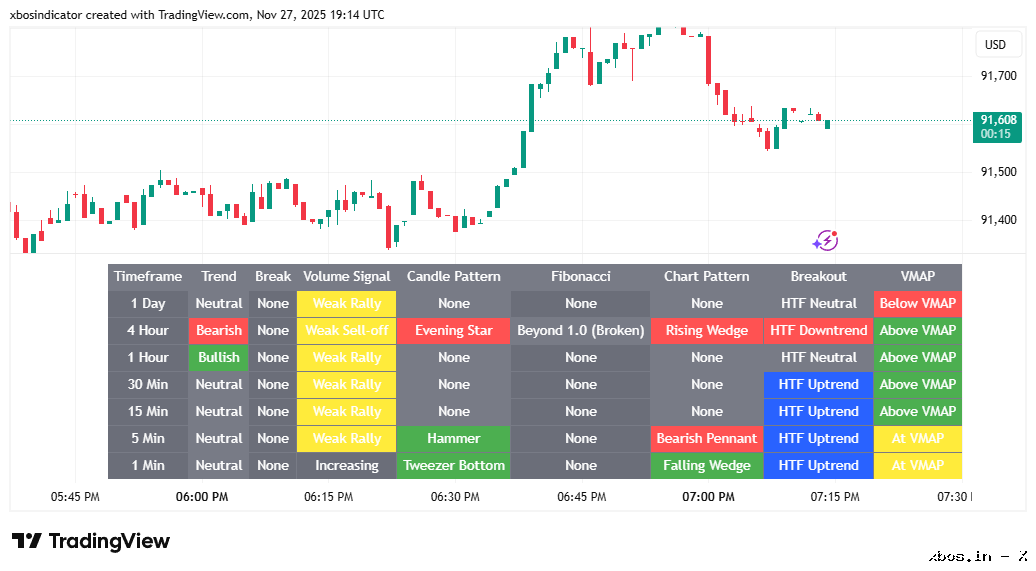
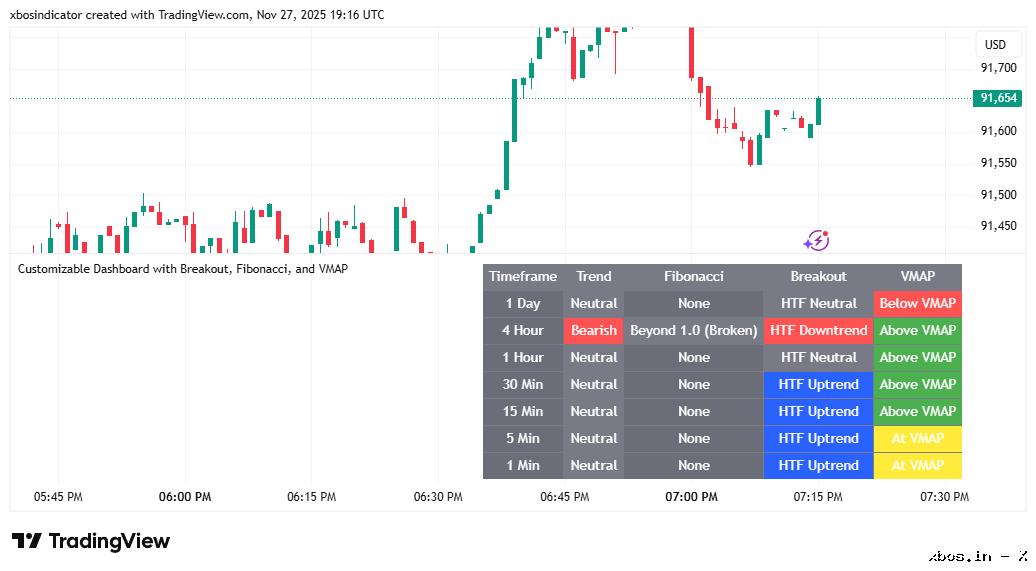
Boost your trading accuracy with the XBOS Multi-Timeframe Technical Analysis Indicator Dashboard, available exclusively on xbos.in. View trend strength, chart patterns, breakouts, and Fibonacci levels across 7 timeframes simultaneously. Designed for stocks, indices, forex, and crypto, this fully customizable indicator features professional breakout logic, smart alerts, and quick-decision mode.
Whether you trade scalping, intraday, or swing, the XBOS Indicator gives you fast, reliable signals to stay ahead of market movements.


Educational Indicator Tools by xbos.in
Our Educational Indicator Tools are designed to help traders learn, practice, and refine their skills in real market conditions—without the pressure of live money trading.
They focus on market structure, momentum, and clarity rather than giving direct buy/sell calls.
Key Features:
📊 Market Condition Awareness – Understand when markets are trending or moving sideways.
🧠 Learning-Oriented Insights – See why a setup works or fails, with examples and explanations.
⏱ Optimal Timeframe Guidance – Learn which timeframes suit different trading styles.
⚠ Risk Awareness – Tools highlight conditions to avoid overtrading and reduce emotional decisions.
🎯 Multi-Instrument Application – Works for Cash, Futures, and Options trading as an educational guide.
Disclaimer: These tools are for educational purposes only. They are not trading advice or recommendations. Always practice with proper risk management and verify setups before trading live capital.
About the Indicators
Q1. What platforms are your indicators compatible with?
All our indicators are built for TradingView and work across stocks, indices, crypto, forex, and options charts on the platform.
Q2. Do I need a TradingView paid account to use them?
No, our indicators work with TradingView’s free plan. However, for best experience (multiple charts, alerts), a Pro plan is recommended.
Q3. Are these indicators beginner-friendly?
Yes! Each indicator comes with simple tooltips, examples, and a YouTube demo. No technical background is needed—just basic trading knowledge.
Q4. Do you provide buy/sell signals?
Some indicators do offer signal alerts, but our focus is on clarity, discipline, and decision support—not “tips” or guaranteed calls.
Can I pick any 2 indicators randomly for the free trial
No, we do not recommend picking indicators at random.
Instead, we strongly advise all users to:
✅ Watch the YouTube demo videos
Each indicator page includes a short video explaining its features, use cases, and ideal trading style (intraday, options, swing, etc.).
✅ Read the description
Understand what each indicator is designed to do—some are built for breakouts, others for sideways detection, IV crush, or Smart Money setups.
✅ Choose based on your strategy
Pick indicators that match your trading style, goals, and the asset class you trade (e.g., NIFTY, stocks, forex).
Once your trial indicators are selected, they cannot be changed.
Please make your choices carefully by reviewing the content provided.
🛡️ Regulatory & SEBI Guidelines
Q1. Is xbos.in SEBI-registered?
No. xbos.in is not a SEBI-registered investment advisor, and we do not provide investment advice, stock tips, or portfolio management services.
Q2 Then how are you qualified to offer these tools?
The founder of xbos.in, Neha Wadhwa, holds NISM 8 (Equity Derivatives) and multiple other SEBI-recognized certifications (PMS, AIF, Mutual Funds, Insurance). With over 13 years of industry experience, the tools are built purely for educational and analytical purposes to assist traders in structuring their approach.
Q3. Are these indicators SEBI-compliant?
Yes. Since we do not offer advisory or recommendation services, our products are aligned with SEBI regulations. These are classified as educational tools, and their use is at the trader’s discretion.
🎁 Free Trial
Q1. How does the free trial work?
You can choose any 2 indicators and try them free for 1 month. No payment needed. You’ll get access on TradingView after identity verification.
Q2. What details do I need to provide for the free trial?
We collect:
- Full Name
- Email (verified)
- Phone Number (OTP)
Q3. Can I choose more than 2 indicators in the trial?
No, the free trial is strictly limited to 2 indicators per user.
Q4. What happens after my trial ends?
You’ll receive a reminder. You can then choose to subscribe monthly to any indicators you liked, or refer friends to earn more free access.
💳 Payments & Subscriptions
Q1. What is the pricing after the trial?
Each indicator is available via a monthly subscription for 5 Indicator (Rs. 1500/month unless specified). Custom plans for multiple indicators are available on request.
Q2. How do I pay?
Payments can be made via Razorpay (UPI/card/net banking) or other supported gateways.
Q3. Is there a refund policy?
We do not offer refunds once the billing cycle has started. Please use the free trial to evaluate first.
🔐 Account & Access
Q1. How do I access the indicators once activated?
We’ll share TradingView invite access to your registered email. Once accepted, the indicators appear under your “Invite-Only Scripts” tab.
Q2. I didn’t receive my access after signing up. What should I do?
Please check your spam folder and TradingView’s invite-only section. If still not found, email support@xbos.in.
Q3. Can I switch indicators after selecting them?
Trial indicators cannot be changed once selected. You can upgrade to a different one after the trial period.
⚠️ Disclaimer
We are not SEBI-registered advisors. All indicators and tools provided are for educational and informational purposes only. They are not investment advice or stock recommendations. Please consult a SEBI-registered advisor before making any trading decisions. Use at your own risk.