Our Indicator Suite – Four Core Categories
At the heart of xbos.in lies a complete suite of TradingView indicators and dashboards designed to give traders an edge across global markets (stocks, indices, forex, crypto)—with tools specially optimized for Indian markets like NIFTY, BANKNIFTY, and SENSEX.
We’ve organized them into Four Core Categories that cover every trading style and market condition:
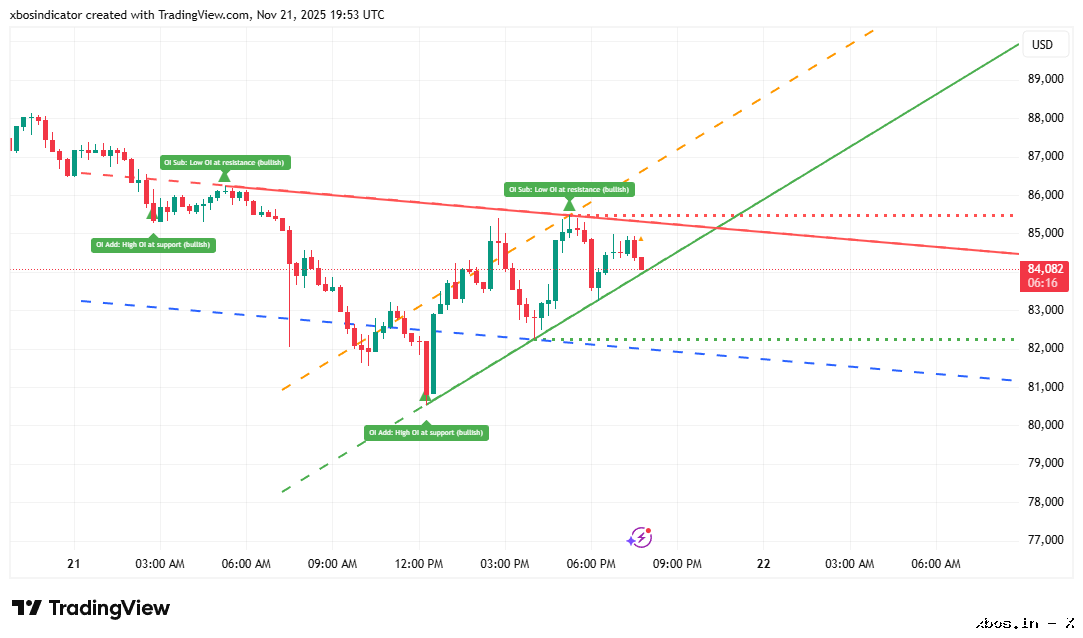
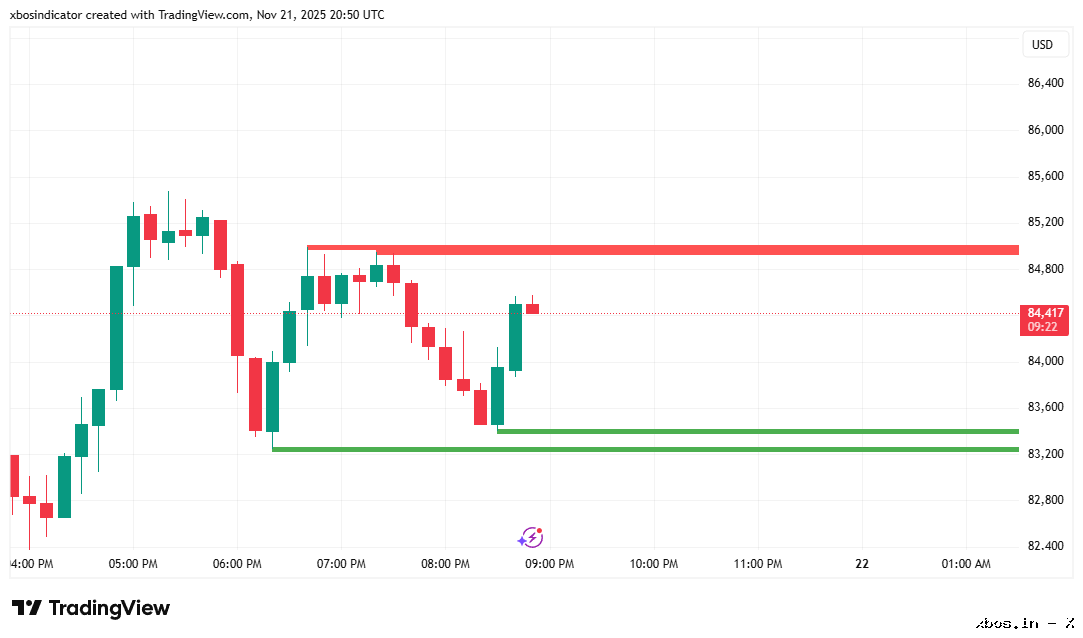
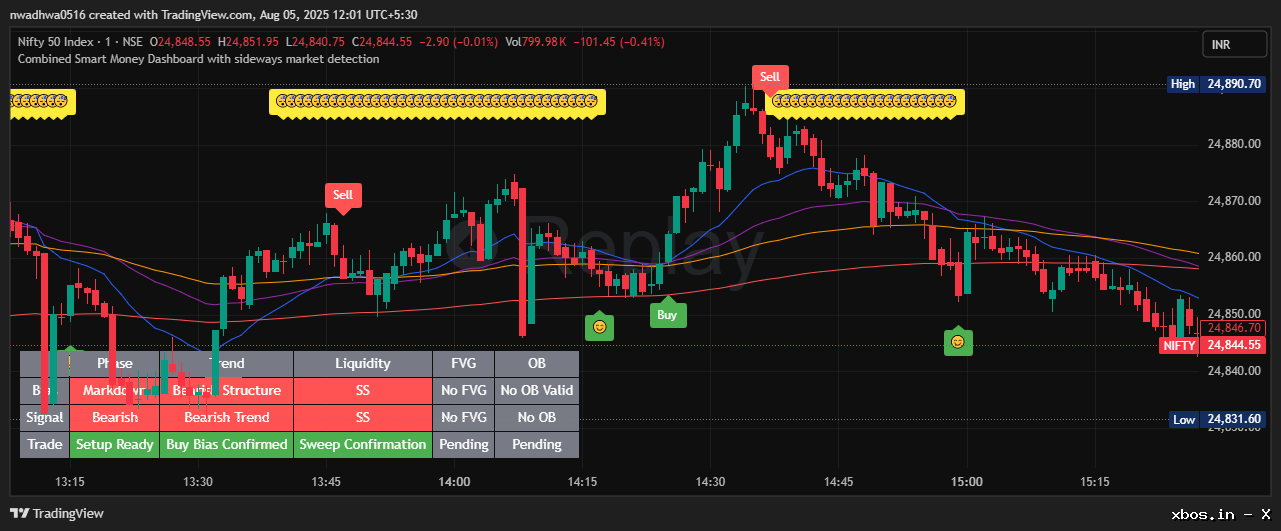
🔹 Smart Money Concept (SMC) Tools
Institutional-style trading made simple. These tools let you follow the footprints of big money by tracking Order Blocks, Fair Value Gaps, Break of Structure (BOS), and Change of Character (CHoCH). Perfect for filtering out noise and focusing only on high-probability setups.
Combined Smart Money Dashboard – Includes sideways market detection for precision entries.
SMC Order Flow Signals – Highlights liquidity shifts and order flow imbalances.
SMC Trading Alerts & Structures – Automated alerts for BOS, CHoCH, and SMC-based patterns.
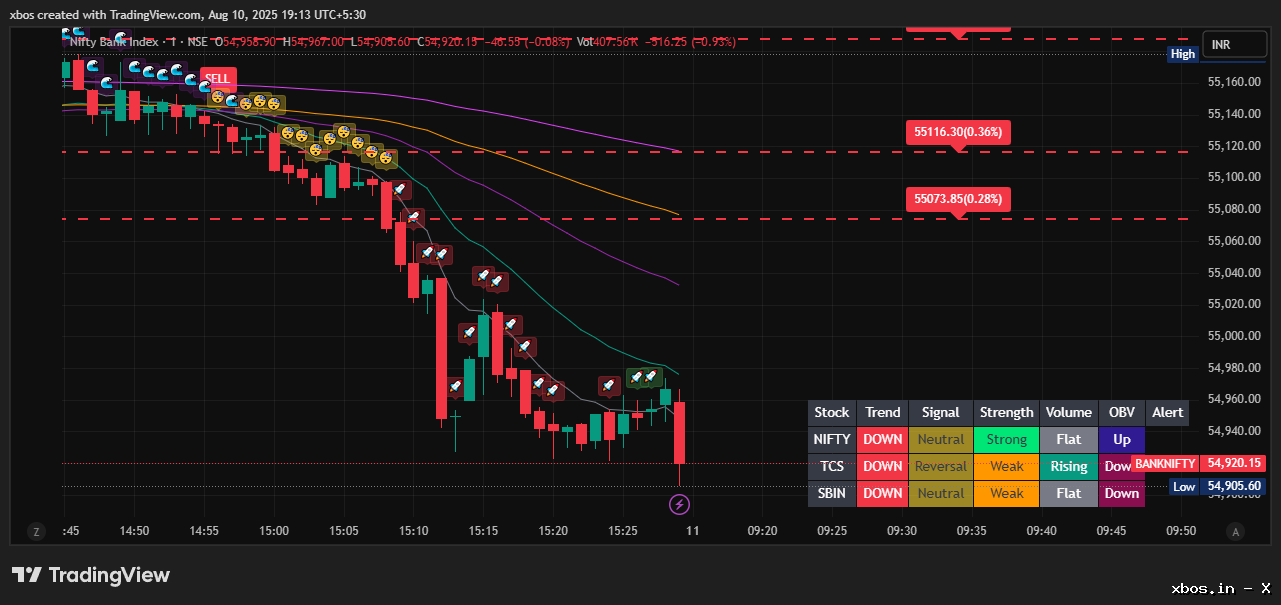
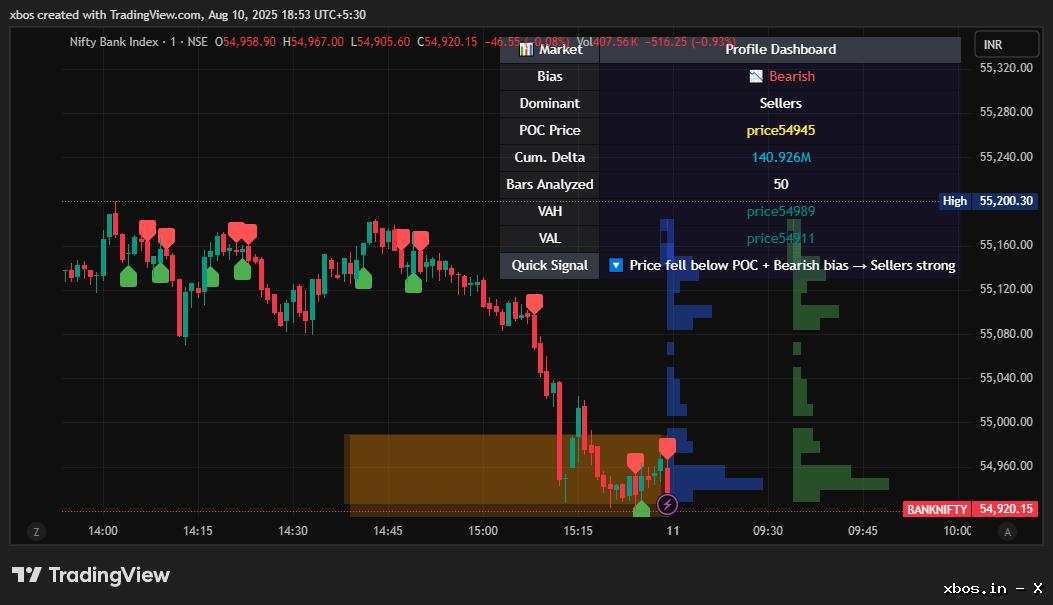
🔹 Trend & Market Profile Tools
Stay in sync with market rhythm. These dashboards combine trend detection, breakout mapping, Fibonacci logic, and market profile analysis to give you deep insights into price action and volume distribution.
Advanced Trading Dashboard & SmartTrade System – Multi-layered tool for detecting trends and setups.
Market Profile Dashboard – Visualizes volume clusters, value areas, and price acceptance zones.
Buy & Sell Sideways Market Alerts – Prevents whipsaw losses by identifying non-trending phases.
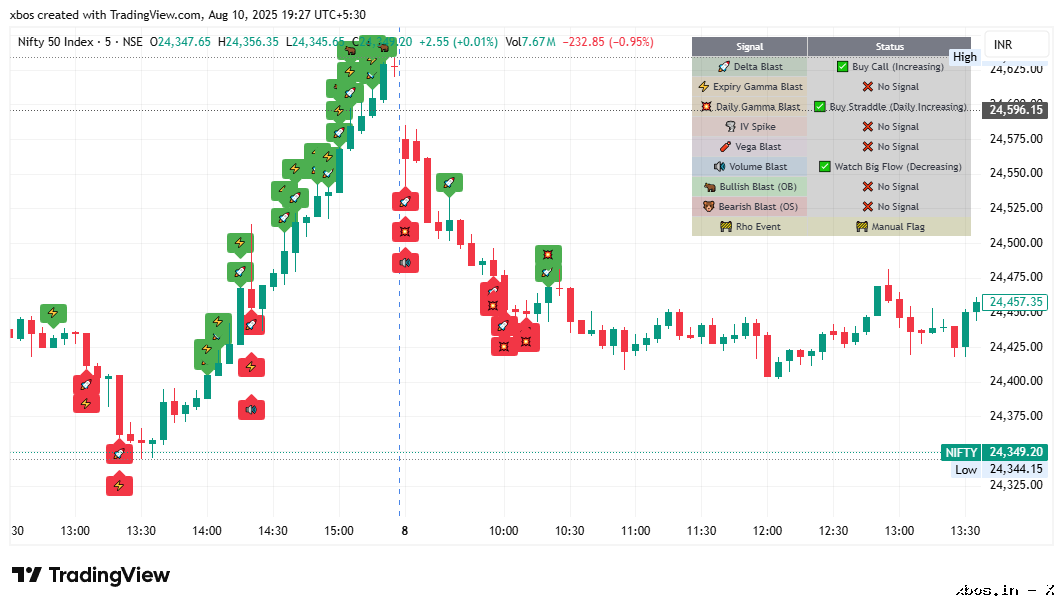
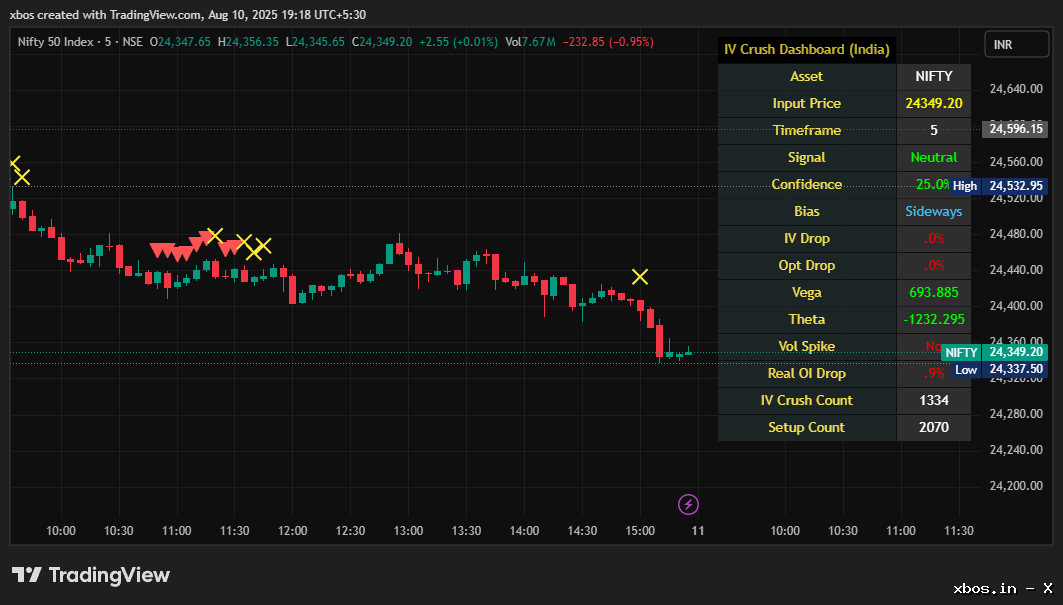
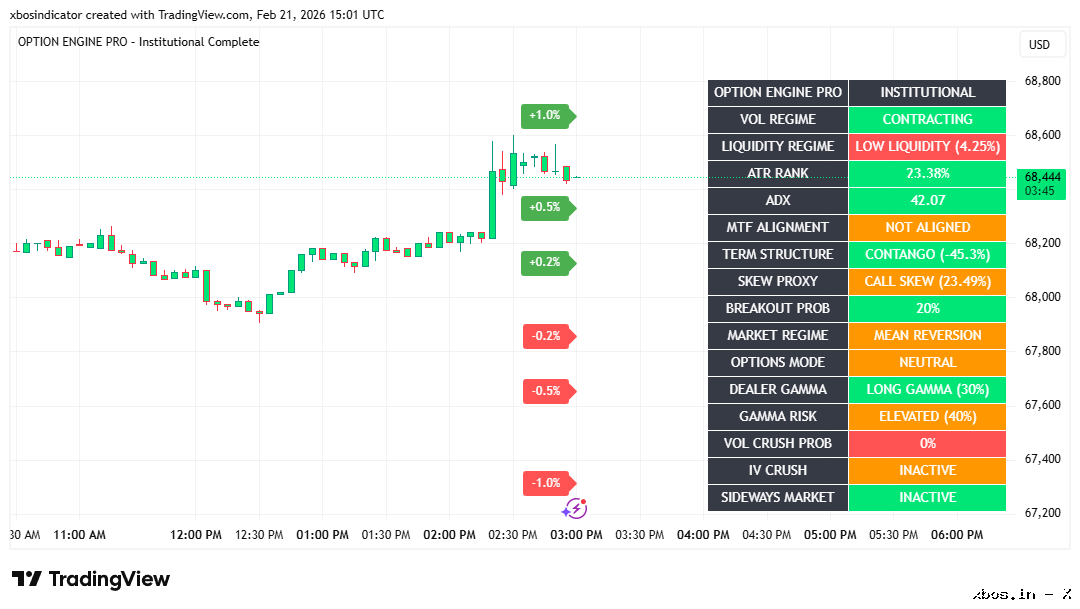
🔹 Option Greeks & Volatility Signals
Precision tools for options traders. Built for NIFTY, BANKNIFTY, SENSEX, and global stocks, these indicators combine Greeks, volatility logic, and expiry analysis to capture explosive intraday moves and expiry setups.
Greek Universal Blast Dashboard – Detects high-momentum option moves powered by Greeks.
IV Crush Signal Dashboard – Spots implied volatility crashes around earnings, news, or expiry.
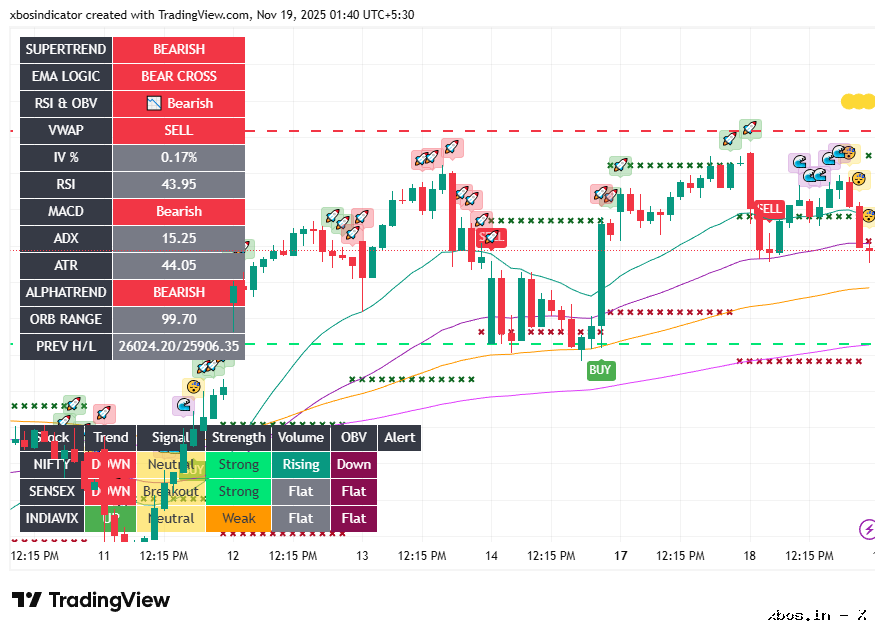
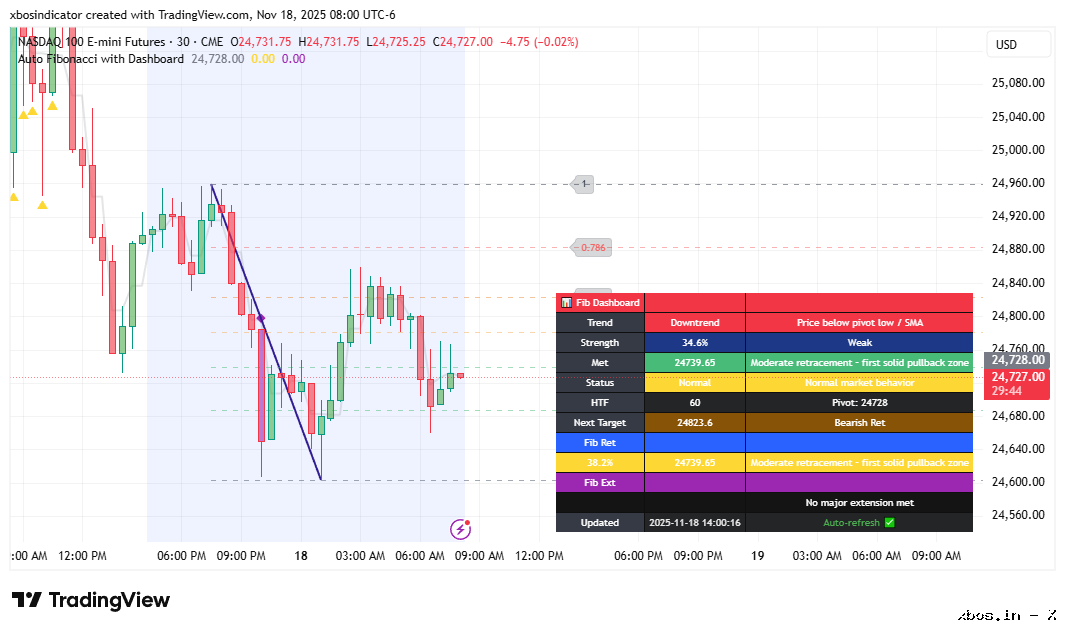
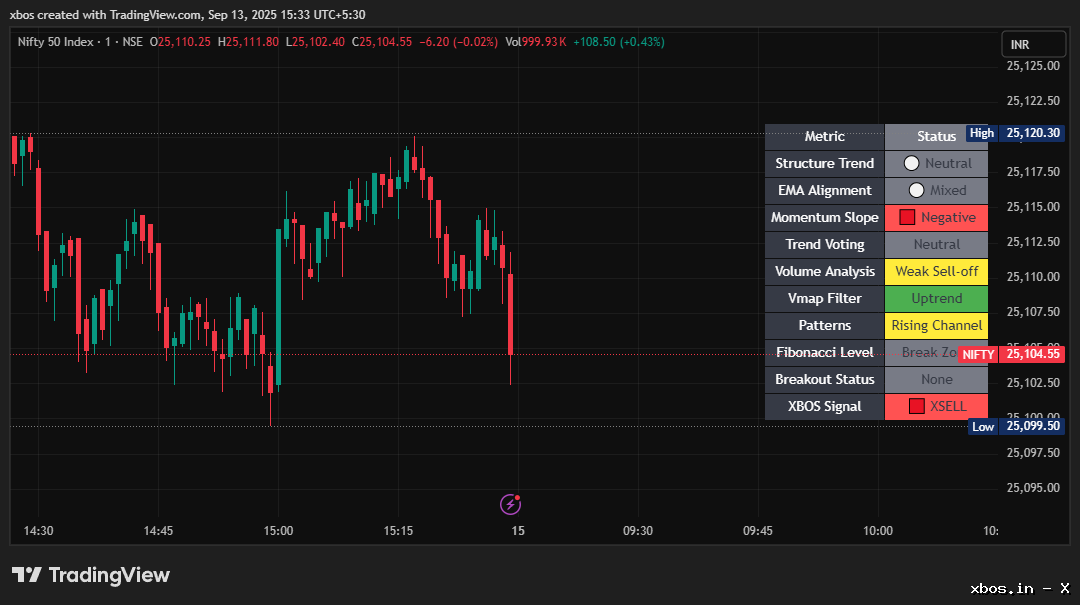
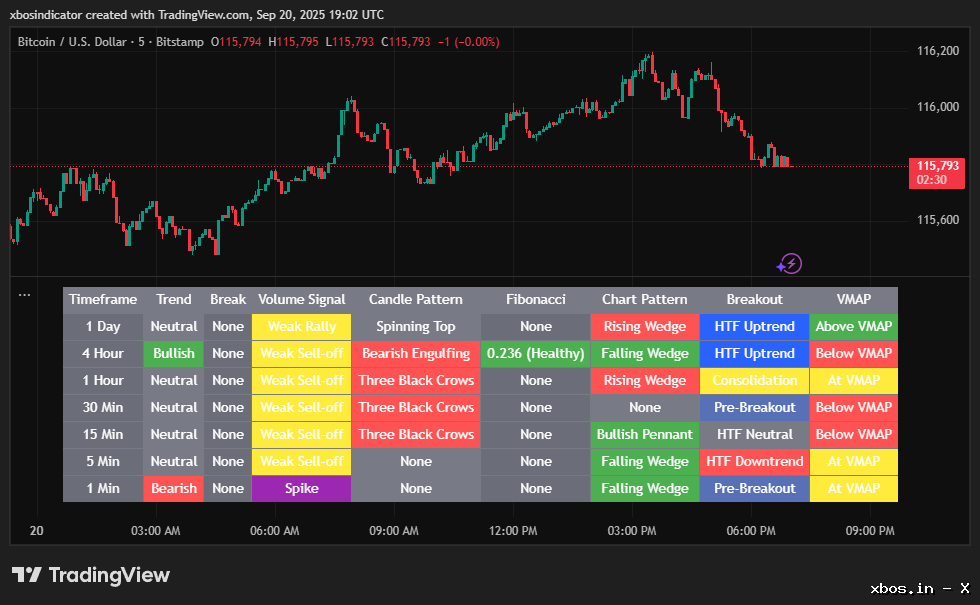
🔹 Technical Dashboards
All-in-one technical analysis. Simplify charting with tools that scan across timeframes, map Fibonacci levels, and combine multiple trading logics into smart, actionable signals.
Multi-Logic Dashboard with Alerts – Combines EMA alignment, momentum, volume, breakout logic, and Fibonacci zones.
Multi-Timeframe Technical Analysis Dashboard – Scans across 7 timeframes for trend, breakout, and pattern confirmation.
Fibonacci Dashboard – Automatically plots retracements, extensions, and pullback zones.
✅ The Complete Edge
Together, these dashboards create a full-spectrum trading ecosystem—covering market structure, order flow, options, volatility, and technicals. Whether you trade stocks, indices, crypto, or options, xbos.in equips you with the tools to spot opportunities faster, avoid traps, and trade with confidence.