Previous
Previous Product Image

Market Profile Dashboard

Original price was: ₹1,300.00.Current price is: ₹1,000.00.
Next

All-in-One Trading Indicator Dashboard

1,600.00
Next Product Image

Multi-Timeframe Technical Analysis Indicator Dashboard

Original price was: ₹1,800.00.Current price is: ₹1,500.00.

Multi-Timeframe Technical Analysis Dashboard – Your all-in-one trading assistant for spotting trends, patterns, breakouts, and Fibonacci zones across 7 timeframes at once. Fully customizable, packed with advanced signal detection, and optimized for stocks, indices, forex, and crypto. Includes professional breakout logic, real-time alerts, and a simplified mode for quick decisions. Whether you’re a scalper or a swing trader, this tool keeps you one step ahead of the market.


Add to Wishlist
Add to Wishlist
Trust Badge Image

Description

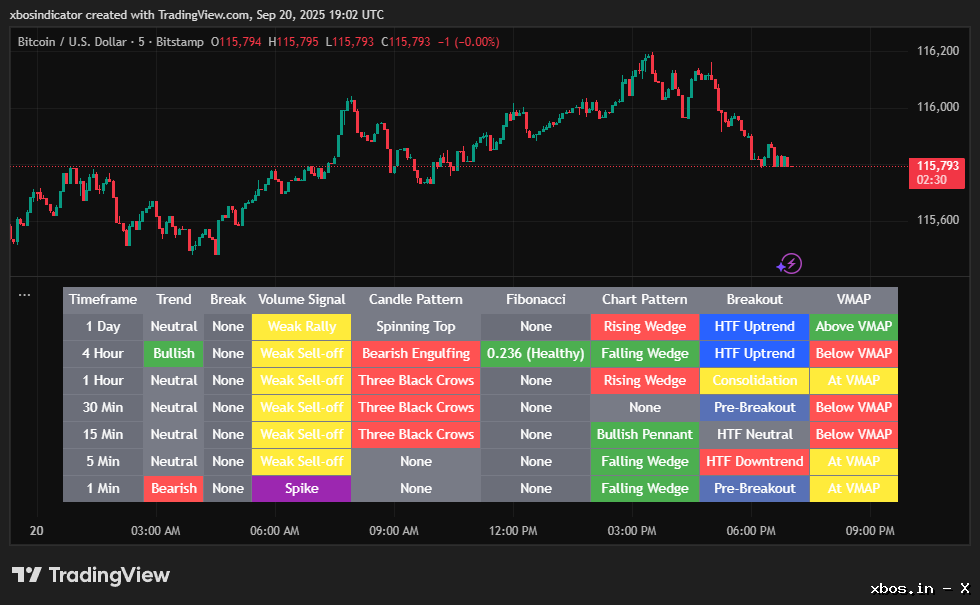
1️⃣ All-in-One Multi-Timeframe Analysis 📊

  • Analyze 7 timeframes (1m → 1D) in one compact dashboard.

  • Quick market overview without switching charts.

2️⃣ Fully Customizable Layout 🎛️

  • Show/hide specific timeframes or signal types (Trend, Break, Volume, Candle, Fibonacci, Patterns, Breakout).

  • Rename column/row headers to fit your style.

  • Pick color themes for bullish, bearish, neutral, caution, reversal, breakout stages, & Fibonacci zones.

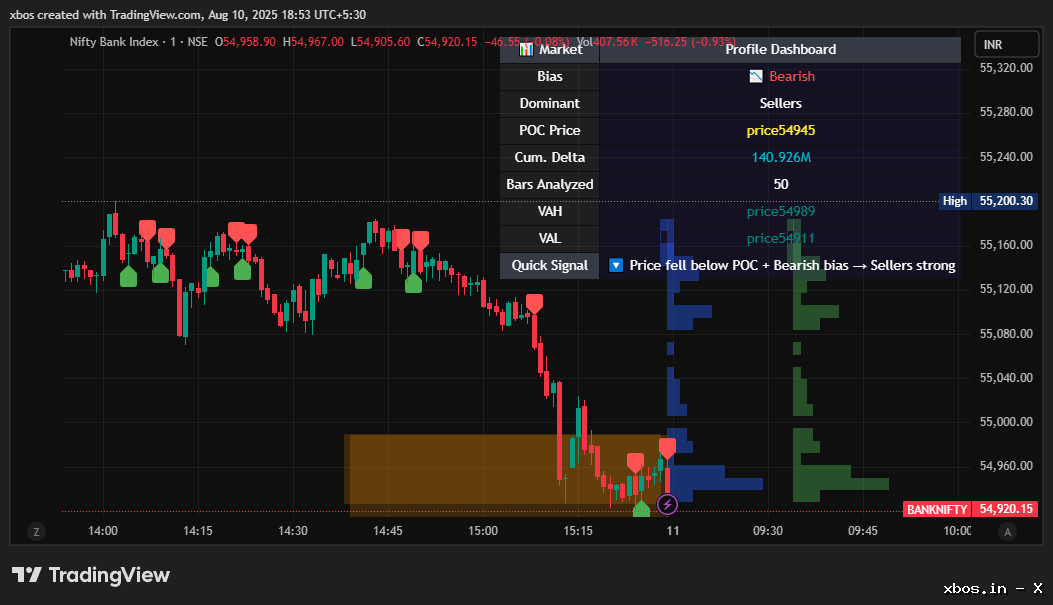
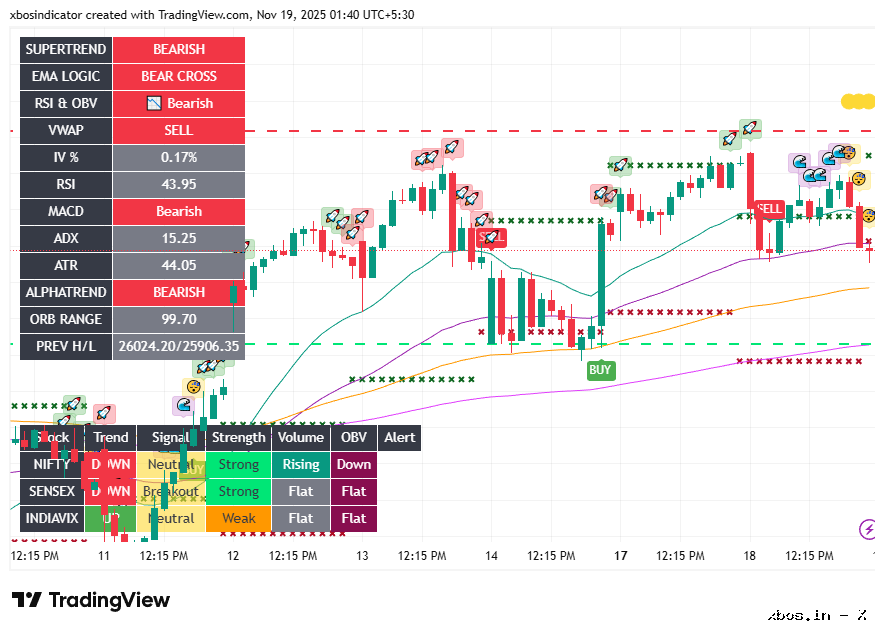
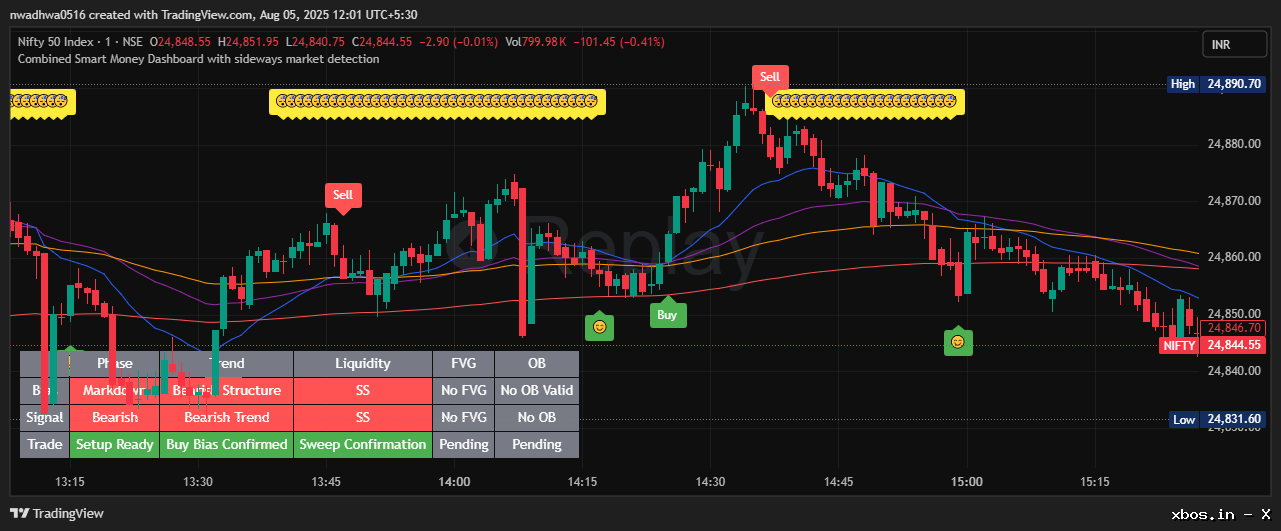
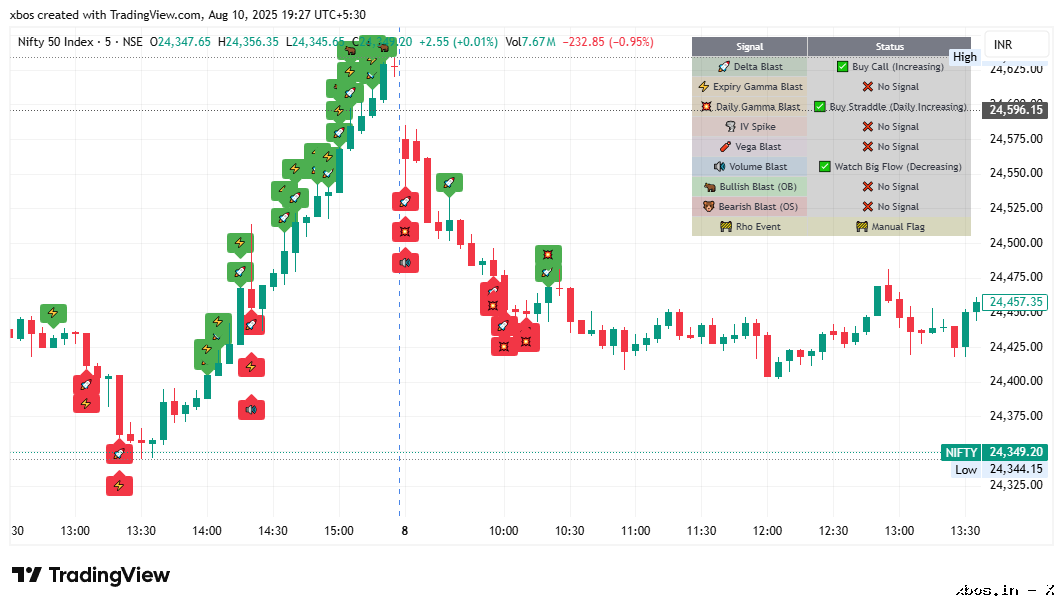
3️⃣ Advanced Signal Detection 🔍

  • Trend: EMA-based with volume confirmation.

  • Market Structure Breaks: Bullish/bearish with Fibonacci integration.

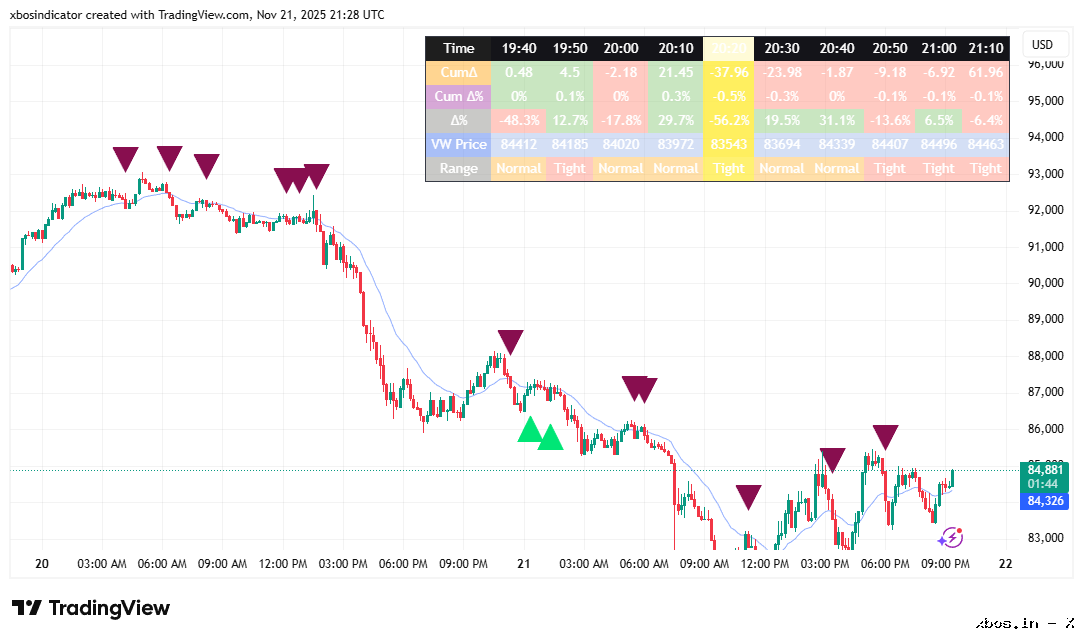
  • Volume: Spike detection, weak rallies/sell-offs.

  • Candlestick Patterns: 20+ classics (Engulfing, Hammer, Doji, Morning/Evening Star, Tweezer, etc.).

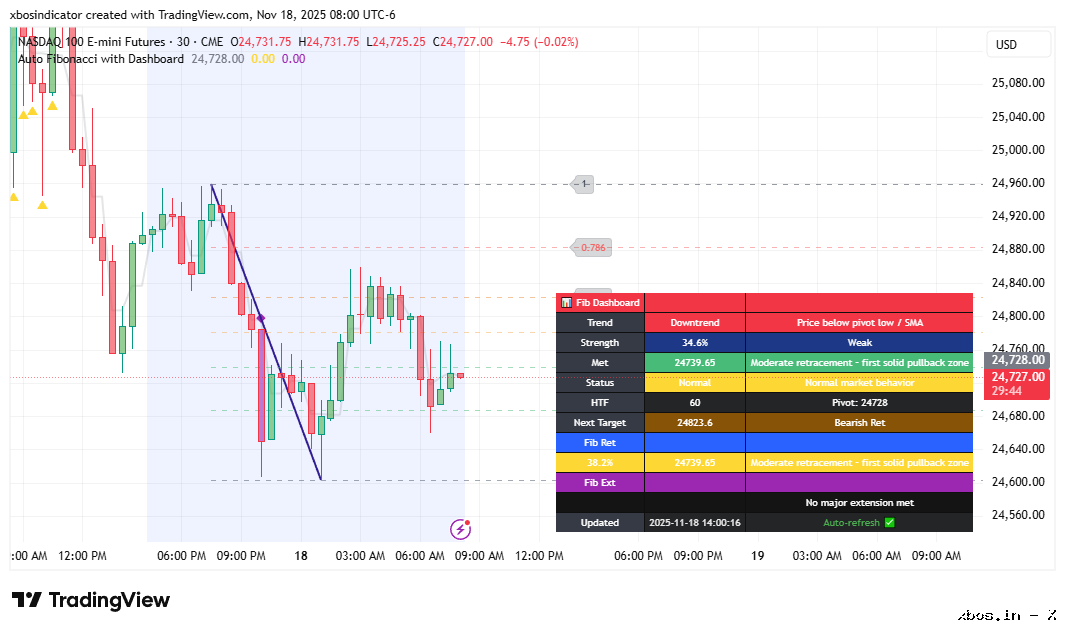
  • Fibonacci Levels: Auto-calculated (0.236–2.618) with tolerance filters & health color codes.

  • Chart Patterns: Double/Triple Tops, Triangles, Flags, Pennants, Wedges, Rectangles, Cup & Handle.

  • Breakouts: Multi-stage from consolidation to entry & exit zones.

4️⃣ Professional Breakout Logic 🚀

  • Higher timeframe trend filters for accuracy.

  • Detects consolidation zones, pre-breakout setups & trigger candles.

  • Aggressive & conservative entry modes.

  • Auto stop-loss levels for risk management.

  • Extra Filters” mode for added precision.

5️⃣ Simplified Mode

  • One-click toggle for minimalist view (Trend, Fibonacci & Breakouts only).

6️⃣ Alerts & Notifications 🔔

  • Set alerts for any timeframe & major signal (trend change, structure break, volume spike, pattern, Fibonacci zone, breakout).

  • High-priority mode for breakouts with Fibonacci confirmation.

7️⃣ Optimized for All Markets 🌎

  • Works for indices, stocks, forex, crypto.

  • Adaptive volume logic for assets without volume data.

8️⃣ Built-In Debug Mode 🛠️

  • Shows pivot points, Fibonacci values, & detection logic on chart for testing.

9️⃣ Flexible Display Position 📐

  • Place dashboard anywhere (top-right, top-left, bottom-right, bottom-left).

Reviews

There are no reviews yet.

Be the first to review “Multi-Timeframe Technical Analysis Indicator Dashboard”

Your email address will not be published. Required fields are marked *

Shopping cart

0
image/svg+xml

No products in the cart.

Continue Shopping

Welcome to Xbos!

As a startup, we're giving you access to 2 full-featured indicators of your choice absolutely free! To support you, we're offering a special Early Bird Unlock Program for the first 500 eligible users. Get discounted access to our full premium indicator suite for up to 6 months at ₹1500/month per coupon.

For further details, please visit the respective pages below.

Unlock 10–12 Proprietary Premium Indicators

We offer a suite of 10–12 advanced, proprietary indicators – tools that typically cost around ₹10,000 each outside. As part of this special offer, you’re gaining access to all of them for just ₹1,500 per month. That’s an average cost of only ₹150 per indicator – empowering you with powerful tools at a fraction of the price.

Free Trial Offer
Early Bird Offer