Previous
Previous Product Image

IV Crush Signal Dashboard

Original price was: ₹800.00.Current price is: ₹500.00.
Next

Multi-Timeframe Technical Analysis Indicator Dashboard

Original price was: ₹1,800.00.Current price is: ₹1,500.00.
Next Product Image

Market Profile Dashboard

Original price was: ₹1,300.00.Current price is: ₹1,000.00.

This advanced Market Profile & Money Flow tool helps traders identify high-probability zones, market bias, and breakout opportunities. It combines Volume Profile, Money Flow analysis, and Cumulative Delta into one clean dashboard, showing where the market is most active and which side — buyers or sellers — is in control.
With built-in POC & Value Area tracking, trade alerts, and high-volume zone markers, it’s designed for both day traders and swing traders to quickly spot support/resistance levels, trend shifts, and momentum surges.

Add to Wishlist
Add to Wishlist
Trust Badge Image

Description

📊 Key Features

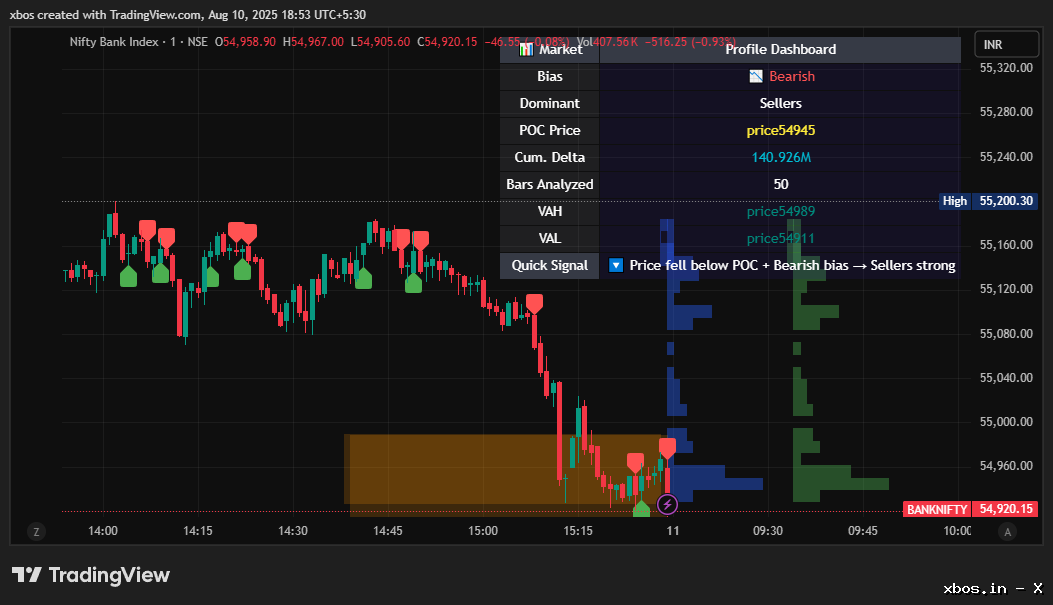
1️⃣ Market Profile Visualization

  • 📦 Volume Profile — See where most trading volume happened within a chosen lookback (200, 100, 50, 20 bars).

  • 💰 Money Flow Profile — Volume × price view to spot where most capital flowed.

  • Orientation Options — Switch between vertical & horizontal layouts.

  • 📏 Customizable Rows — Control granularity with adjustable price bins (default: 25).


2️⃣ Value Area & POC Tracking

  • 📌 Value Area High/Low (VAH/VAL) — Auto-calculated 70% value area around POC.

  • 🎯 POC (Point of Control) — Price level with highest volume or money flow.

  • 🖌 Value Area Highlight — Visual zone fill for quick identification.

  • Flexible Lookback — Adapt periods for changing market conditions.


3️⃣ Bias & Market Sentiment Dashboard

  • 📈 Bias — Bullish, 📉 Bearish, or ➡️ Sideways from flow analysis.

  • Dominant Side — Buyers vs. sellers strength meter.

  • 💬 Quick Signal — Context clues like “Price above POC + Bullish bias → Buyers strong”.

  • 🔄 Cumulative Delta — Running buy/sell pressure difference.

  • 🧾 Bars Analyzed — Displays the lookback scope.


4️⃣ Trade Signals & Alerts

  • 🚨 POC Breakouts — Alerts when price crosses POC.

  • 📍 VAH/VAL Crossovers — Alerts for moves outside value area.

  • 🔄 Bias Flips — Alerts on sentiment changes with delta confirmation.

  • 💪 Delta Strength/Weakness — Detects buyer/seller dominance.

  • TradingView-Ready — All alerts work for automation or notifications.


5️⃣ High-Volume Zone Highlighting

  • 🟣 HVZ Markers — Purple dotted lines at key high-volume levels.

  • 🛡 Support/Resistance Clues — Use HVZ as market reaction zones.


6️⃣ Visual Enhancements

  • 🖥 Dashboard HUD — Clean top-right table with bias, POC, VAH/VAL, quick signal.

  • ⬆⬇ Breakout Arrows — Visual cues for POC moves.

  • 🎛 Offset Controls — Fine-tune X/Y positions for profiles & dashboard.

Reviews

There are no reviews yet.

Be the first to review “Market Profile Dashboard”

Your email address will not be published. Required fields are marked *

Shopping cart

0
image/svg+xml

No products in the cart.

Continue Shopping

Welcome to Xbos!

As a startup, we're giving you access to 2 full-featured indicators of your choice absolutely free! To support you, we're offering a special Early Bird Unlock Program for the first 500 eligible users. Get discounted access to our full premium indicator suite for up to 6 months at ₹1500/month per coupon.

For further details, please visit the respective pages below.

Unlock 10–12 Proprietary Premium Indicators

We offer a suite of 10–12 advanced, proprietary indicators – tools that typically cost around ₹10,000 each outside. As part of this special offer, you’re gaining access to all of them for just ₹1,500 per month. That’s an average cost of only ₹150 per indicator – empowering you with powerful tools at a fraction of the price.

Free Trial Offer
Early Bird Offer