Previous
Previous Product Image

Greek Universal Blast Dashboard

Original price was: ₹2,500.00.Current price is: ₹2,000.00.
Next

Market Profile Dashboard

Original price was: ₹1,300.00.Current price is: ₹1,000.00.
Next Product Image

IV Crush Signal Dashboard

Original price was: ₹800.00.Current price is: ₹500.00.

IV Crush Detection


A specialized options market tool designed to spot sharp post-event implied volatility (IV) drops—commonly seen after earnings or expiry—across NIFTY, BANKNIFTY, and SENSEX. It combines IV, option price, vega, theta, volume, and open interest metrics to produce a confidence score (0–100), classifying signals as IV Crush, Setup, or Neutral. India-optimized with precise expiry detection and IST timing, the dashboard is fully customizable, offering trend bias analysis, visual chart markers, and real-time alerts. Built-in OI analysis and historical signal tracking help traders validate opportunities and adapt strategies effectively.

Add to Wishlist
Add to Wishlist
Trust Badge Image

Description

IV Crush Detection

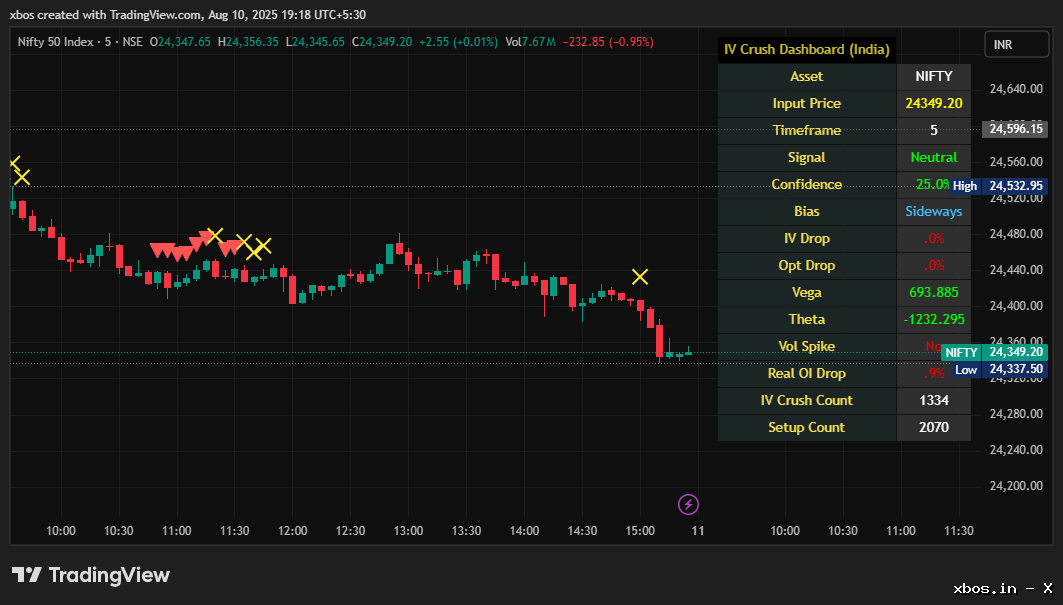
Identifies sharp Implied Volatility (IV) drops post-events (e.g., earnings, option expiries) for NIFTY, BANKNIFTY, and SENSEX, using metrics like IV drop, option price drop, vega, theta, volume spikes, and open interest (OI) changes.

India-Specific Optimization: Supports Indian market conventions with accurate weekly (Thursdays for NIFTY/BANKNIFTY, Tuesdays for SENSEX) and monthly expiry detection, plus IST (UTC+5:30) timezone handling for precise signal timing.

Confidence Score: Calculates a weighted score (0–100) based on IV drop, option price drop, price movement, volume spikes, OI drop, vega, theta, and expiry timing, categorizing signals as IV Crush (≥70), Setup (40–69), or Neutral (<40).

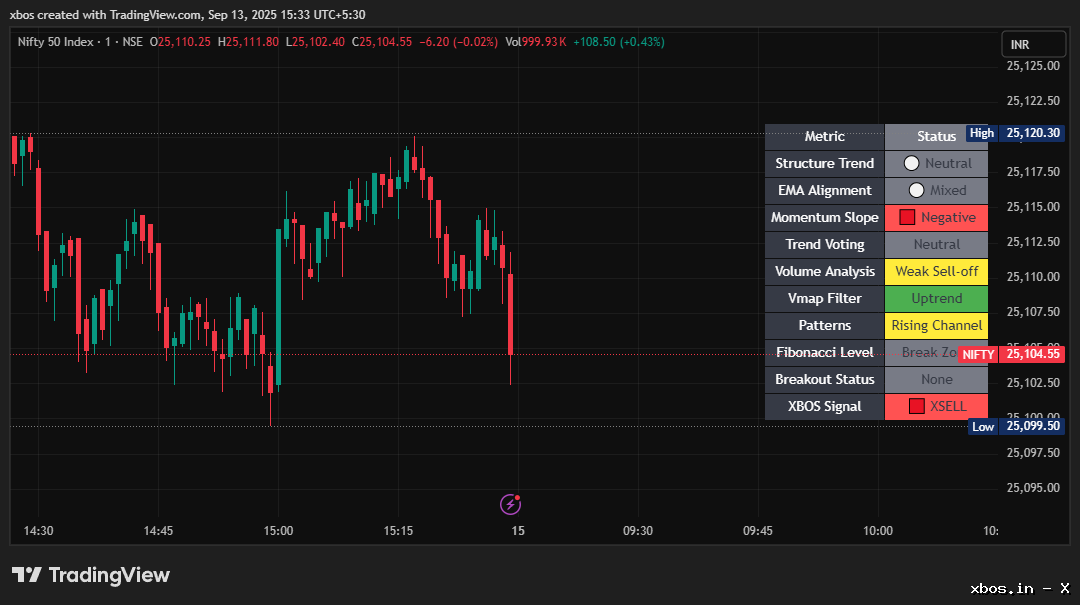
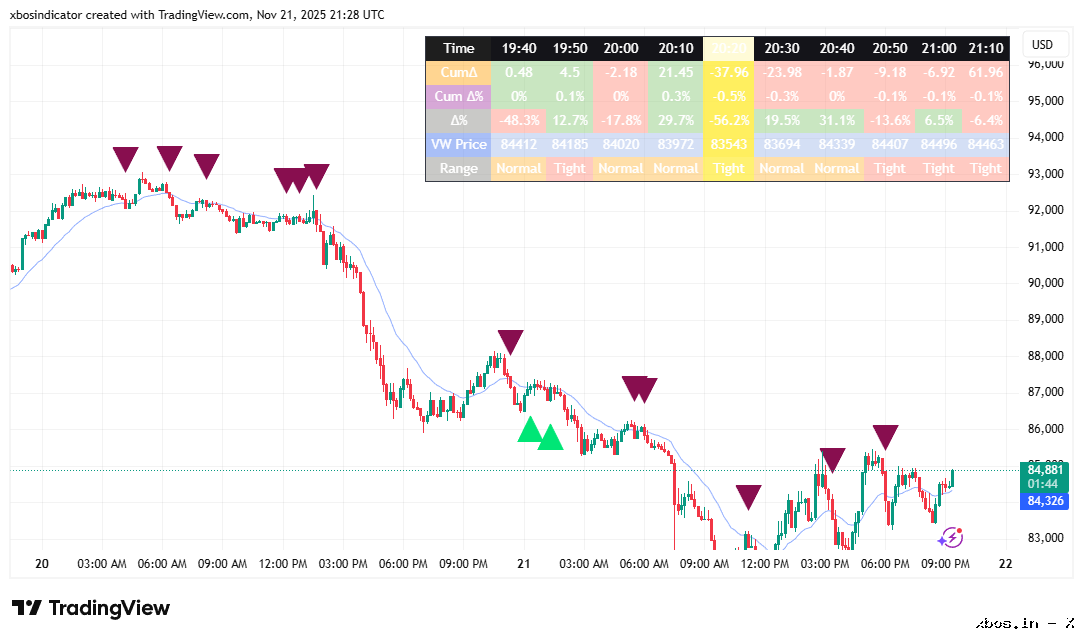
Customizable Dashboard: Displays key metrics (asset, timeframe, signal type, confidence, trend bias, IV drop, option price drop, vega, theta, volume spike, OI drop) with user-toggled columns and compact mode for streamlined viewing.

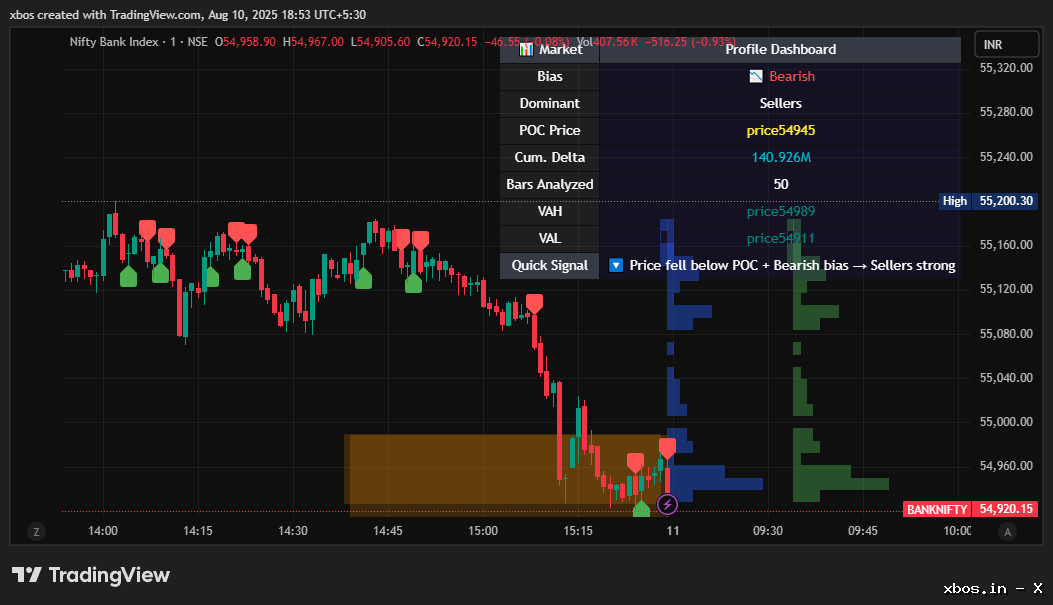
Trend Bias Analysis: Determines market direction (Bullish, Bearish, Sideways) using EMA, RSI, MACD, ADX, and option price trends to align trades with market context.

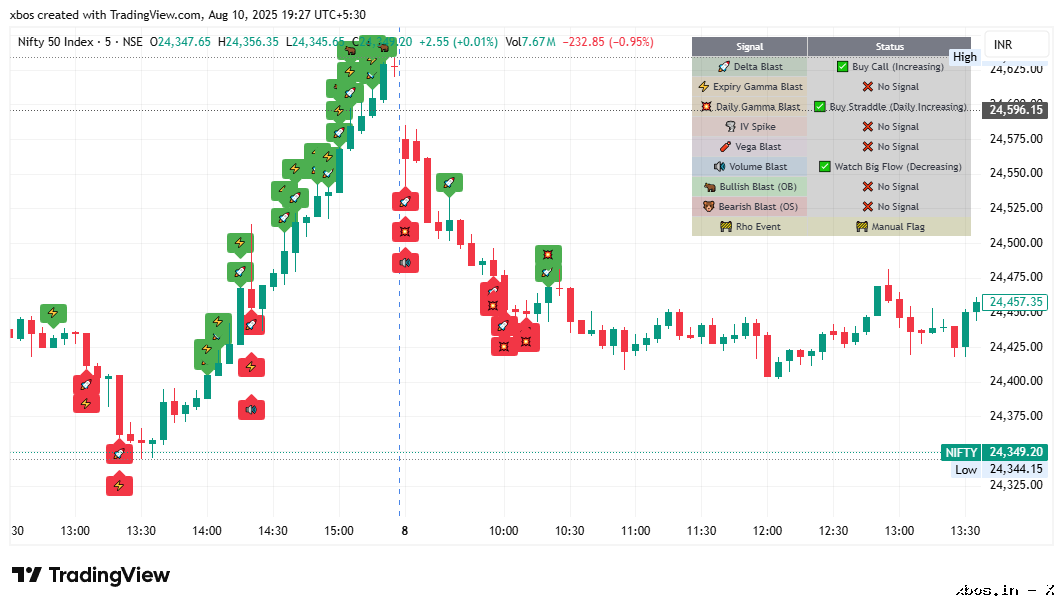
Visual Signals: Plots red triangle-up for IV Crush and yellow triangle-down for Setup signals on the chart for quick identification.

Alert Integration: Configurable alerts for IV Crush and Setup signals, including ticker, input price, and confidence score, for real-time trading notifications.

Flexible Inputs: Customizable parameters like strike price (ATM or user-defined), lookback period, risk-free rate, dividend yield, expiry hour, IV mode (Call/Put), and thresholds for IV drop, option price drop, vega, theta, price move, volume spike, and OI drop.

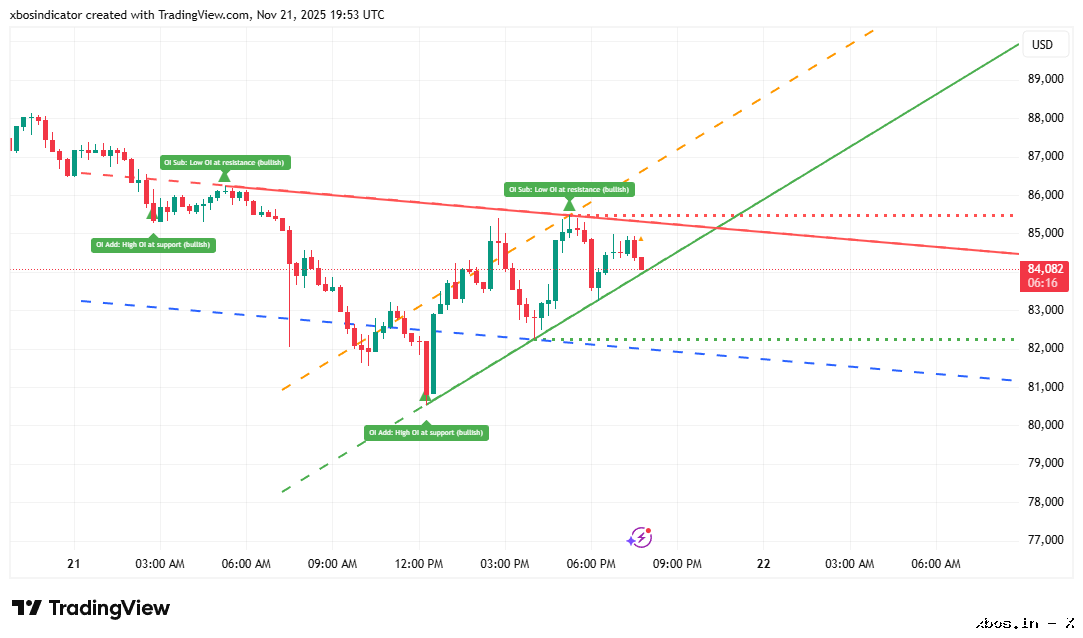
Open Interest Analysis: Detects significant OI drops using real or simulated data, enhancing IV Crush signal reliability.

Signal Tracking: Counts IV Crush and Setup signals for historical context, aiding traders in assessing signal frequency and reliability.

Reviews

There are no reviews yet.

Be the first to review “IV Crush Signal Dashboard”

Your email address will not be published. Required fields are marked *

Shopping cart

0
image/svg+xml

No products in the cart.

Continue Shopping

Welcome to Xbos!

As a startup, we're giving you access to 2 full-featured indicators of your choice absolutely free! To support you, we're offering a special Early Bird Unlock Program for the first 500 eligible users. Get discounted access to our full premium indicator suite for up to 6 months at ₹1500/month per coupon.

For further details, please visit the respective pages below.

Unlock 10–12 Proprietary Premium Indicators

We offer a suite of 10–12 advanced, proprietary indicators – tools that typically cost around ₹10,000 each outside. As part of this special offer, you’re gaining access to all of them for just ₹1,500 per month. That’s an average cost of only ₹150 per indicator – empowering you with powerful tools at a fraction of the price.

Free Trial Offer
Early Bird Offer